
Figure 1.
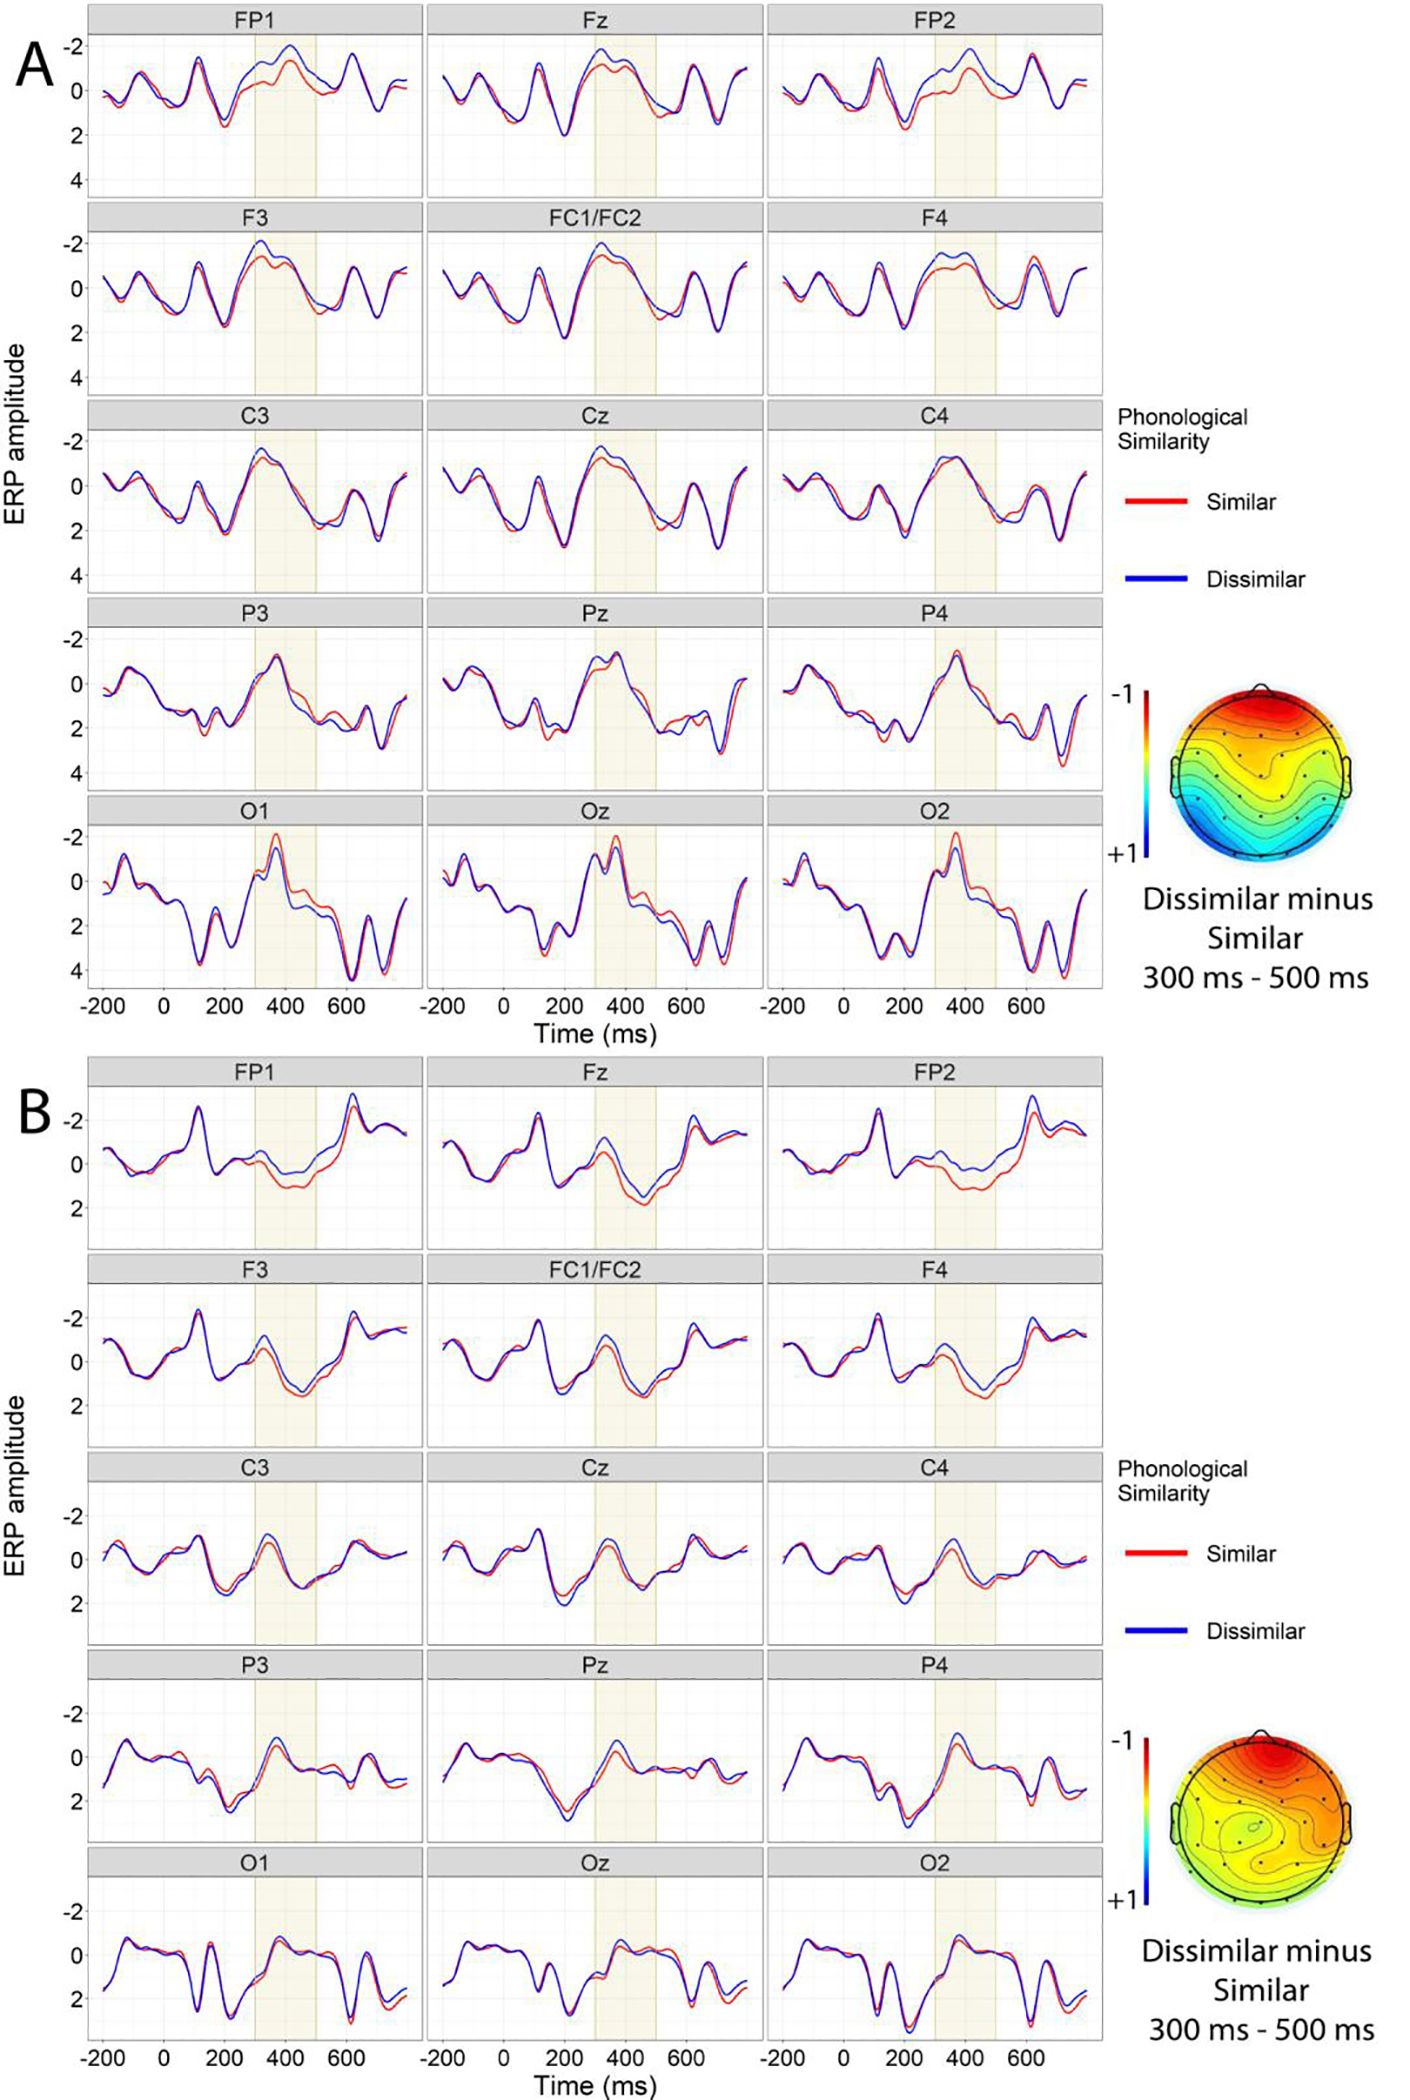
Grand average brain waveforms of younger (Panel A) and older adults (Panel B) time-locked to NP2 onset. The critical time window is highlighted. Results showed smaller N400 amplitudes (at frontal sites) for NP2s that followed phonologically similar relative to phonologically dissimilar NP1s.