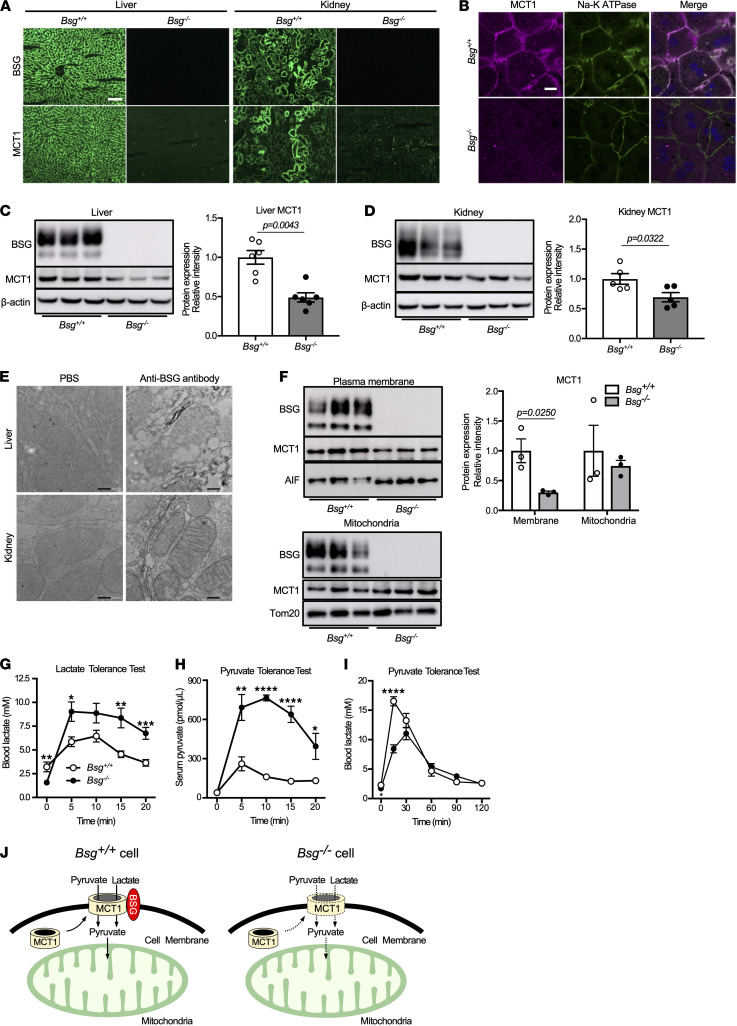
Figure 1. BSG regulates lactate and pyruvate import through interaction with MCTs.
(A) Immunofluorescence staining for BSG and MCT1 in the liver and renal cortex of tissues from wild-type (Bsg+/+) and Bsg-deficient (Bsg–/–) mice. Scale bar: 100 μm. (B) Representative photographs of isolated Bsg+/+ or Bsg–/– hepatocytes by immunocytochemical staining. Scale bar: 20 μm. (C and D) Western blotting analysis of BSG and MCT1 expression in the liver (C) and the kidneys (D) of Bsg+/+ and Bsg–/– mice. The intensities of the BSG and MCT1 bands were normalized to those of β-actin, a housekeeping protein that was used as a loading control. White columns and circles, Bsg+/+ mice; gray columns and black circles, Bsg–/– mice. Data are presented as means ± SEM (n = 5–6). Scatter plots display the data for individual mice. (E) Immunoelectron microscopic assessment of BSG expression in mitochondria of the liver and kidneys. Scale bar: 200 nm. (F) MCT1 expressions in plasma membranes and mitochondria of Bsg+/+ and Bsg–/– hepatocytes as determined by Western blotting. White columns and circles, Bsg+/+ hepatocytes; gray columns and black circles, Bsg–/– hepatocytes. Data are presented as means ± SEM (n = 3). Scatter plots display the data for individual mice. (G) Blood lactate concentrations in Bsg+/+ and Bsg–/– mice during lactate tolerance tests. (H and I) Serum pyruvate (H) and blood lactate (I) concentrations during pyruvate tolerance tests. For G–I, data are presented as means ± SEM; n = 7 (G) or 5–9 (H and I). *P < 0.05, **P < 0.01, ***P < 0.001, ****P < 0.0001, not significant (P ≥0.05), for a comparison of Bsg+/+ and Bsg–/– mice at the indicated time point (2-tailed unpaired Student’s t test). (J) A schematic illustrating lactate and pyruvate dynamics via MCT-Bsg complexes in hepatocytes derived from Bsg+/+ mice compared with Bsg–/– hepatocytes.

