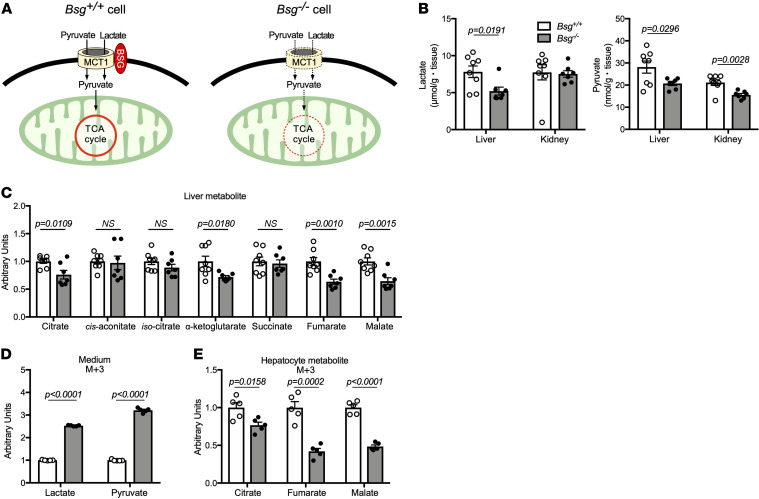
Figure 2. Bsg deficiency leads to depletion of TCA cycle intermediates in the liver.
(A) Schematic illustrating the facilitation by the MCT/BSG complex of the import of substrates used by the TCA cycle. (B and C) Static metabolome analysis for lactate and pyruvate in livers and kidneys (B) and TCA cycle intermediates in livers (C) from fasted Bsg+/+ or Bsg–/– mice. White columns and circles, Bsg+/+ mice; gray columns and black circles, Bsg–/– mice. Data are presented as means ± SEM (n = 7–8). Scatter plots display the data for individual mice. P values represent results for a comparison of Bsg+/+ and Bsg–/– mice for the indicated metabolite (2-tailed unpaired Student’s t test). (D) Levels of 13C3-labeled lactate and pyruvate in the media from isolated Bsg+/+ or Bsg–/– hepatocytes, respectively. White columns, Bsg+/+ hepatocytes; gray columns, Bsg–/– hepatocytes. n = 5 for independent experiments. (E) 13C3-labeled lactate/pyruvate flux into TCA cycle intermediates, such as citrate, fumarate, and malate, in isolated hepatocytes.

