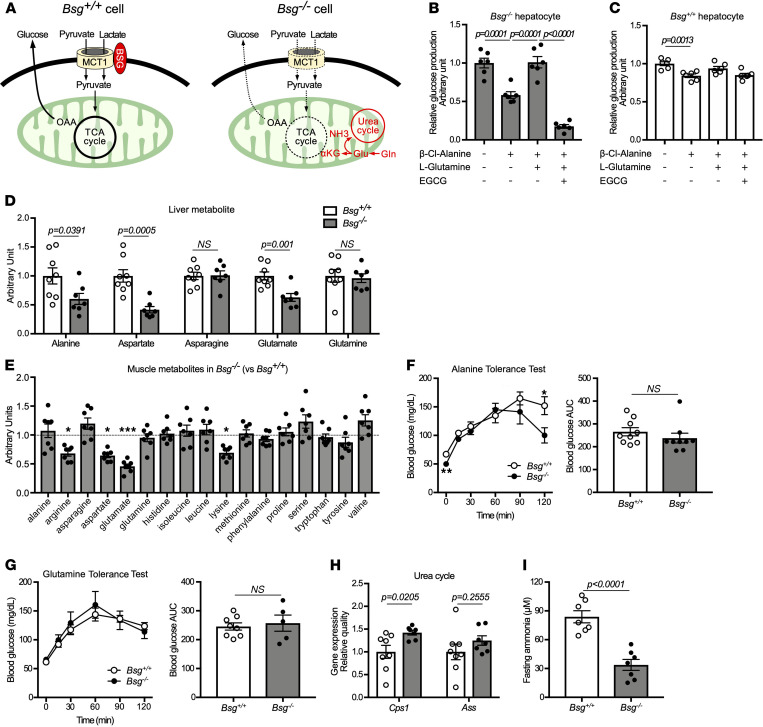
Figure 4. Bsg deficiency is compensated for by alternative circuits that provide utilization of glycogenic amino acids into the TCA cycle.
(A) Schematic illustrating use of the glycogenic amino acid pathway to compensate for impaired gluconeogenesis resulting from Bsg deficiency. Ala, alanine; NH3, ammonia; αKG, α-ketoglutaric acid; Glu, glutamate; Gln, glutamine. (B and C) Endogenous glucose production in hepatocytes isolated from Bsg–/– (B) and Bsg+/+ (C) animals when cells were cultured in the absence or presence of 250 μM β-chloro-l-alanine hydrochloride (an inhibitor of Ala transaminase), 10 mM l-glutamine, and 20 μM EGCG (an inhibitor of Glu dehydrogenase) for 4 hours. Gray columns and black circles, Bsg–/–; white columns and circles, Bsg+/+ (n = 6/genotype). Scatter plots display the data for individual mice. Statistical analyses were performed using a 1-way ANOVA with post hoc Tukey’s test for multiple comparisons. (D and E) Static metabolome analysis of amino acids in livers (D) and skeletal muscles (E) from fasted Bsg+/+ or Bsg–/– mice (n = 7–8/genotype). Levels of amino acids in Bsg–/– skeletal muscles are exhibited with respect to those of Bsg+/+ muscles. (F and G) Blood glucose levels and AUC scores in fasting Bsg+/+ and Bsg–/– mice during alanine (F) or glutamine (G) tolerance tests (n = 5–9/genotype). (H) Expression levels of transcripts encoding ureagenesis-related proteins, including CPS1 and argininosuccinate synthase (ASS). mRNA levels were normalized to those encoding the housekeeping protein β-actin (n = 7–8/genotype). (I) Serum ammonia values in fasting Bsg+/+ and Bsg–/– mice (n = 7/genotype). For all relevant panels, data are presented as means ± SEM. *P < 0.05, **P < 0.01, ***P < 0.001, for the comparison of Bsg+/+ and Bsg–/– at the indicated time point (2-tailed unpaired Student’s t test).

