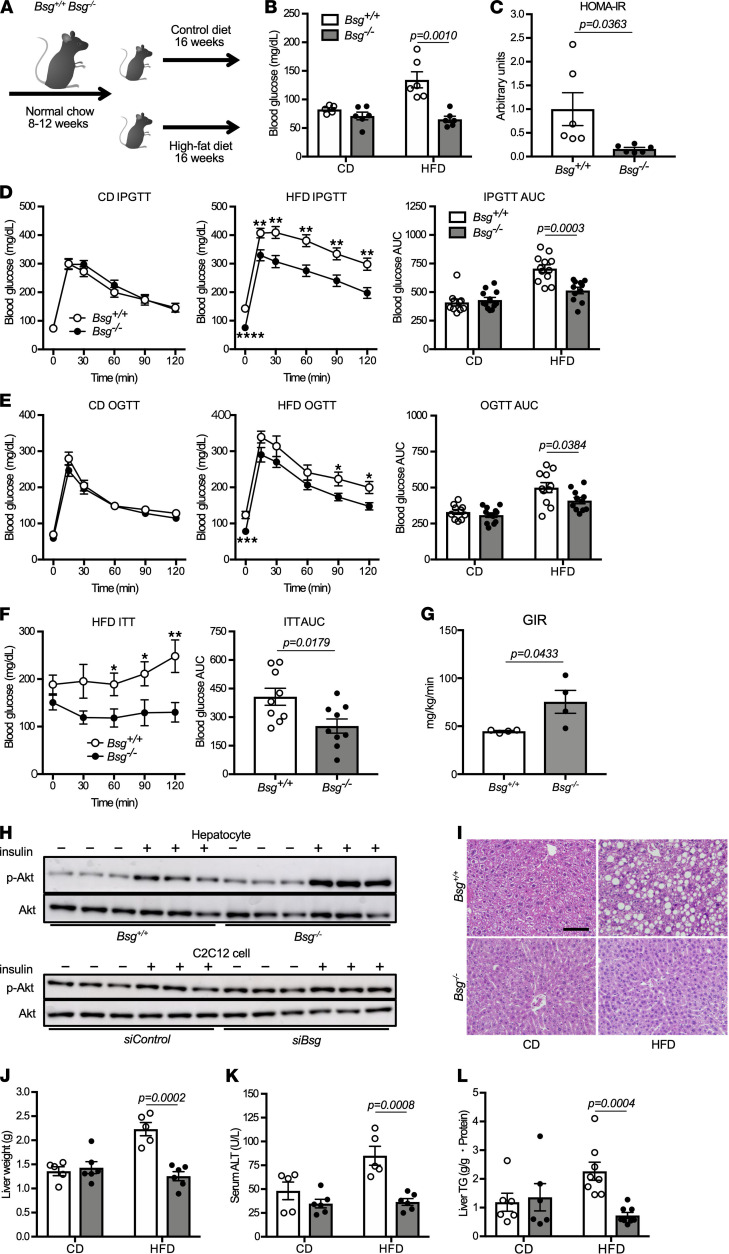
Figure 6. Bsg deficiency protects mice from HFD-induced insulin resistance.
(A) Schematic diagram of the in vivo experiments used to test the effects of 16 weeks of nutritional overburden. (B) Fasting blood glucose levels in Bsg+/+ and Bsg–/– mice maintained for 16 weeks on standard CD or HFD (n = 5–6/genotype and diet combination). White columns and circles, Bsg+/+ mice; gray columns and black circles, Bsg–/– mice. Scatter plots display the data for individual mice. (C) HOMA-IR in HFD-fed Bsg+/+ and Bsg–/– mice (n = 6/genotype). (D and E) Glucose excursions and the AUC scores in Bsg+/+ and Bsg–/– mice (maintained on CD or HFD for 16 weeks) when subjected to (D) IP glucose tolerance tests or (E) oral glucose tolerance tests (n = 10–12/genotype and diet combination). (F) Glucose excursions and the AUC scores in Bsg+/+ or Bsg–/– mice (maintained on HFD for 16 weeks) when administered IP with insulin (0.6 units/kg body weight) (n = 9/genotype). (G) GIR in 8- to 12-week-old Bsg+/+ or Bsg–/– mice after insulin infusion in the hyperinsulinemic-euglycemic clamp study (n = 4/genotype). (H) Akt phosphorylation in isolated hepatocytes and C2C12 cells in the absence or presence of insulin as demonstrated by Western blotting analysis. (I) Representative micrographs of H&E-stained sections showing hepatic steatosis in Bsg+/+ and Bsg–/– mice. Scale bar: 200 μm. (J–L) Liver weight (J), serum ALT values (K), and liver TG content (L) in CD-fed or HFD-fed Bsg+/+ and Bsg–/– mice (n = 5–8/genotype and diet combination). For all relevant panels, data are presented as means ± SEM. *P < 0.05, **P < 0.01, for the comparison of Bsg+/+ and Bsg–/– at the indicated time point (2-tailed unpaired Student’s t test).

