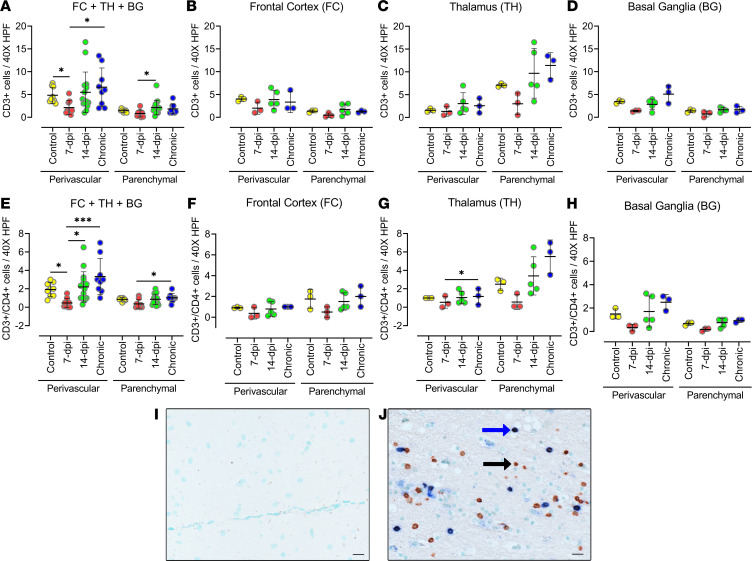
Figure 11. The number of CD3+ (CD4−) and CD3+CD4+ T lymphocytes decreases in SIV-infected macaque brains during the first week of infection.
(A–H) The CD3+ (CD4−) (A–D) and CD3+CD4+ (E–H) T lymphocytes in frontal cortex, basal ganglia, and thalamus of SIV-infected macaque brain at 7 and 14 dpi. The sections were stained through double IHC staining using anti-CD3 and anti-CD4 antibodies. Analysis of double-positive cells in the 3 brain regions combined (A and E) and in individual brain regions: frontal cortex (B and F), thalamus (C and G), and basal ganglia (D and H). Each data point indicates 1 animal, and the associated numerical value is the average number of cells counted in 15 HPFs at 40× under light microscope. (I and J) IHC images of negative control (I) and positive staining (single stained [black arrow] for CD3 in brown; double stained [blue arrow] for CD3 and CD4 in brown and blue, respectively) (J). Data are presented as mean ± SD. Statistical significance was calculated using a nonparametric Kruskal-Wallis test and multiple comparisons were assessed using Dunn’s post hoc analysis. *P ≤ 0.05, ***P ≤ 0.001. n =3 (control, 7 dpi, chronic), n = 5 (14 dpi) (A–H). Scale bar: 20 μm (I and J).

