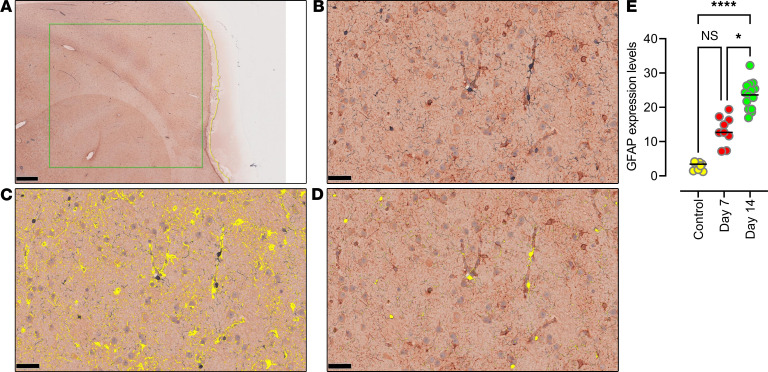
Figure 3. Quantitative determination of GFAP and Iba-1 expression using tissue image analysis.
(A–E) Quantitative expression analysis of GFAP and Iba-1 was performed by scanning a representative 50 mm2 area in the frontal cortex histological section immunostained for GFAP and Iba-1 markers. Microphotograph of a histological section of the frontal cortex (A) chosen for multiplex IHC showing positive immunostaining represented by DAB staining for GFAP and blue chromogen staining for Iba-1 (B). By markup highlighting the positively stained areas for GFAP (C) and Iba-1 (D), quantitative analysis was carried out using HALO software (v2.3.2089.27 or v3.0.311.405; Indica Labs). The graphical representation of significantly increased GFAP expression levels at 14 dpi when compared with control and 7 dpi (E). Scale bars: 1 mm (A) and 50 μm (B–D). Data are presented as mean ± SD. Statistical significance was calculated using a nonparametric Kruskal-Wallis test and multiple comparisons were assessed using Dunn’s post hoc analysis. *P ≤ 0.05, ****P ≤ 0.0001. n = 3 (control, 7 dpi), n = 5 (14 dpi) (E).

