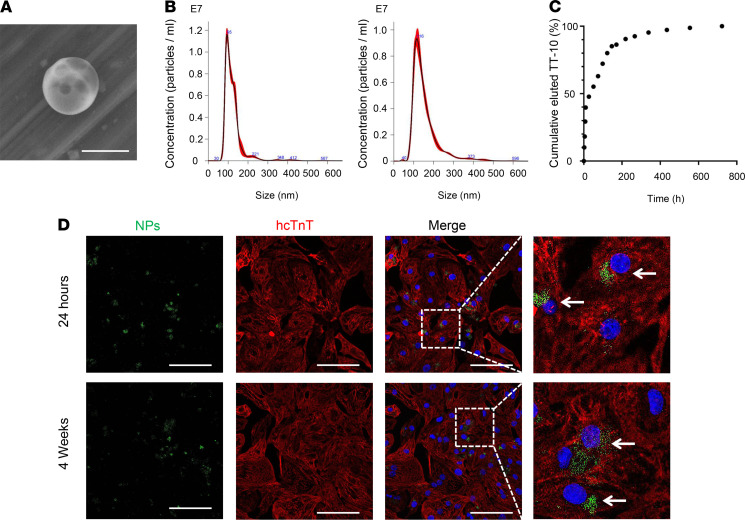
Figure 3. Cultured TT-10–NPs released TT-10 for more than 4 weeks and were taken up by hiPSC-CMs.
(A) PLGA NPs were imaged via scanning electron microscopy. A representative image of a TT-10–NP is shown. Scale bar: 200 nm. (B) The size distribution of the empty PLGA NPs (Empty-NP) (left) and TT-10–NPs (right) was evaluated via nanoparticle tracking analysis. (C) The kinetics of TT-10 release from TT-10–NPs were determined with a dialysis device. Suspensions of TT-10–NPs were incubated at 37°C, and samples of the elution medium were withdrawn and replaced at the indicated time points. Then, the cumulative percentage of TT-10 that had been released from the NPs was calculated for each time point. (D) hiPSC-CMs were cultured with NPs (2 μg/mL) that had been loaded with coumarin-6 (green) for 24 hours or 4 weeks. Then, the cells were immunofluorescently stained for hcTnT (red), and nuclei were identified by DAPI staining (blue). Internalized NPs are identified with arrows. Scale bar: 20 μm.

