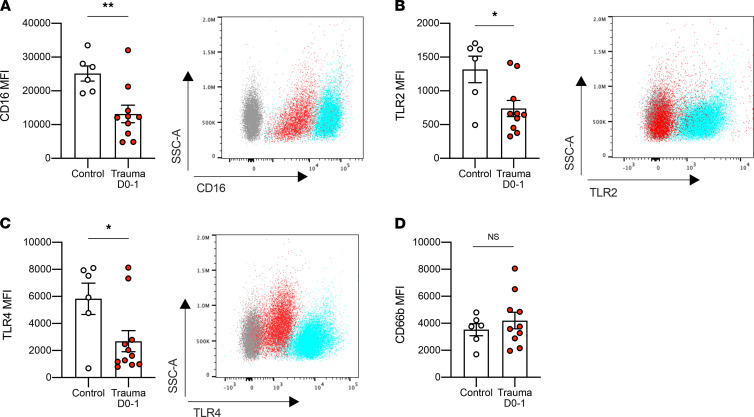
Figure 6. Trauma injury downregulates CD16, TLR2, and TLR4 expression in circulating PMN in patients.
(A–D) MFI of CD16, TLR2, TLR4, and CD66b in circulating PMN collected from control patients (n = 6) and trauma patients on day 0 or 1 (n = 9) measured by flow cytometry. A representative flow cytometry analysis image is shown on the right (except for CD66b). Gray represents unstained cells, blue the control, and red the trauma. All data are presented as mean ± SEM. Statistical analysis was performed by using unpaired 2-tailed Student’s t test. *P < 0.05, **P < 0.01.

