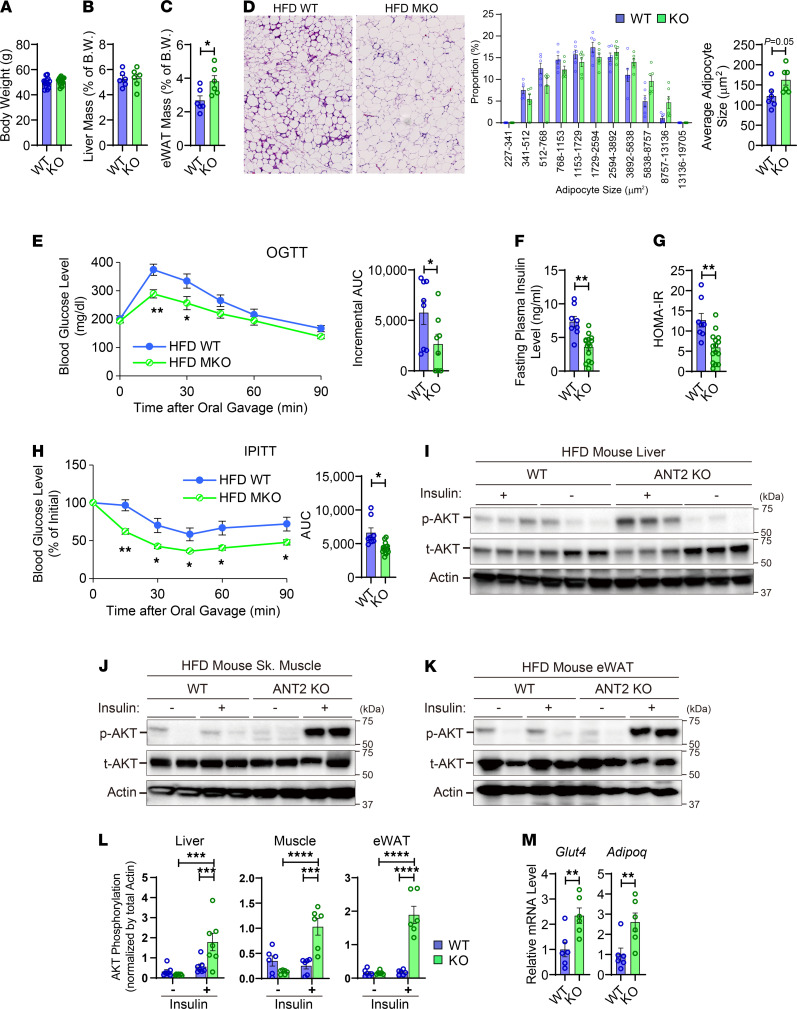
Figure 1. Myeloid-specific ANT2 depletion improves insulin sensitivity and glucose tolerance in obesity.
(A) Body weight of HFD-fed WT and ANT2-MKO mice (n = 6 mice per group). (B) Liver mass of HFD-fed mice (n = 6 mice per group). (C) eWAT mass of HFD-fed mice (n = 6 mice per group). (D) Hematoxylin and eosin (H&E) staining (left) of eWAT sections of HFD-fed WT and ANT2-MKO mice (n = 6 mice per group). Microscopic images were taken under ×20 magnification. The distribution of adipocyte sizes (middle) and average adipocyte size (right) were plotted. (E) Oral glucose tolerance tests (OGTTs) in HFD-fed mice (n = 8 WT and 9 ANT2-MKO mice). (F) Fasting (6 hours) plasma insulin levels (n = 8 WT and 14 ANT2-MKO mice). (G) HOMA-IR in (E) mice. (H) Intraperitoneal insulin tolerance test (IPITT) in HFD-fed mice (n = 8 WT and 14 ANT2-MKO mice). (I) Insulin-stimulated Akt phosphorylation (p-AKT) in liver of HFD mice. t-AKT, total AKT. (J) Insulin-stimulated Akt phosphorylation in skeletal muscle (quadriceps) of HFD-fed mice. (K) Insulin-stimulated Akt phosphorylation in eWAT of HFD-fed mice. (L) Insulin-stimulated Akt phosphorylation in skeletal muscle, liver, and eWAT of HFD-fed WT and ANT2-MKO mice (n = 6 [skeletal muscle and eWAT] and 7 [liver]mice per group). (M) mRNA expression of Glut4 and Adipoq in eWAT of HFD-fed mice (n = 6 WT and 6 ANT2-MKO mice). In all panels, values are mean ± SEM. *P < 0.05; **P < 0.01; ***P < 0.001; ****P < 0.0001. Statistical analysis was performed by 2-tailed, unpaired t test (C and D, right; E, right; F and G; H, right; and M) or 2-way ANOVA (E, left; H, left; and L) with Tukey’s multiple comparison test.

