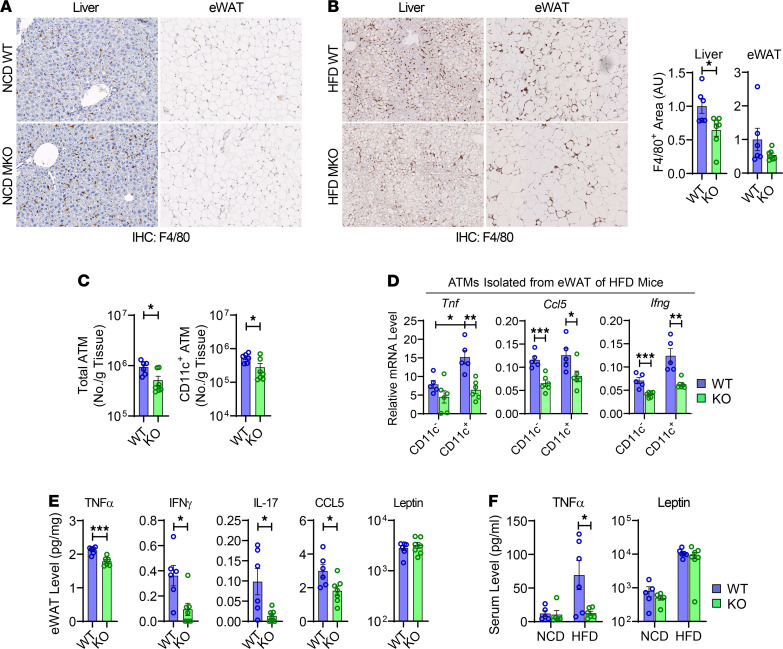
Figure 2. Myeloid-specific ANT2 depletion ameliorates adipose tissue inflammation in obesity.
(A) IHC analysis of F4/80+ cells in liver and eWAT of NCD-fed WT and ANT2-MKO mice. Tissue samples harvested from 5 WT and 5 ANT2-MKO individual mice were analyzed and representative pictures are shown. (B) IHC analysis of F4/80+ cells in liver and eWAT of HFD-fed WT and ANT2-MKO mice (n = 6 and 7 mice). Representative pictures are shown on the left. Relative proportion of F4/80+ area per given section area was calculated and plotted (middle, liver; right, eWAT). AU, arbitrary unit. Microscopic images were taken under ×20 magnification (A and B). (C) Flow cytometry analysis of total and CD11c+ ATMs in eWAT of HFD-fed mice (n = 6 WT and 7 ANT2-MKO mice). (D) mRNA expression of inflammatory genes in ATMs isolated from eWAT of HFD-fed mice (n = 5 WT and 6 ANT2-MKO mice). (E) Proinflammatory cytokine levels in eWAT of HFD-fed WT and ANT2-MKO mice (n = 5, 6, 5, and 7 NCD- and HFD-fed WT and ANT2-MKO mice, respectively). (F) Serum TNF-α and leptin levels in WT and ANT2-MKO mice (n = 5, 6, 5, and 7 NCD- and HFD-fed WT and ANT2-MKO mice, respectively). All values are mean ± SEM. *P < 0.05; **P < 0.01; ***P < 0.001. Statistical analysis was performed by 2-tailed, unpaired t test (B and C) or 1-way ANOVA (D and F) with Tukey’s multiple comparison test.

