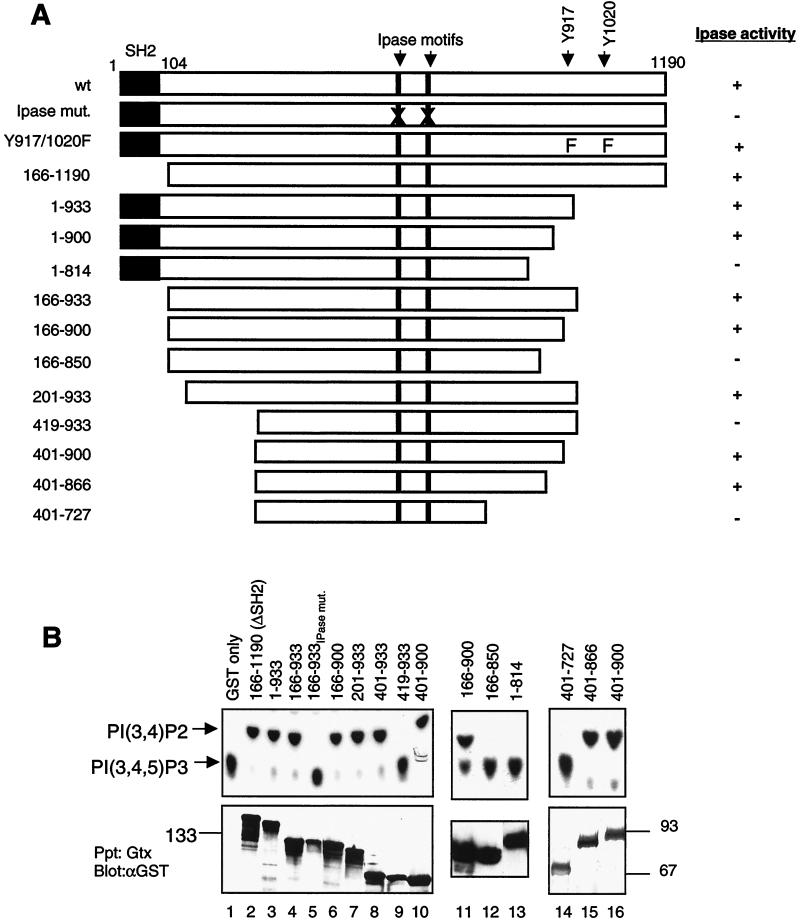
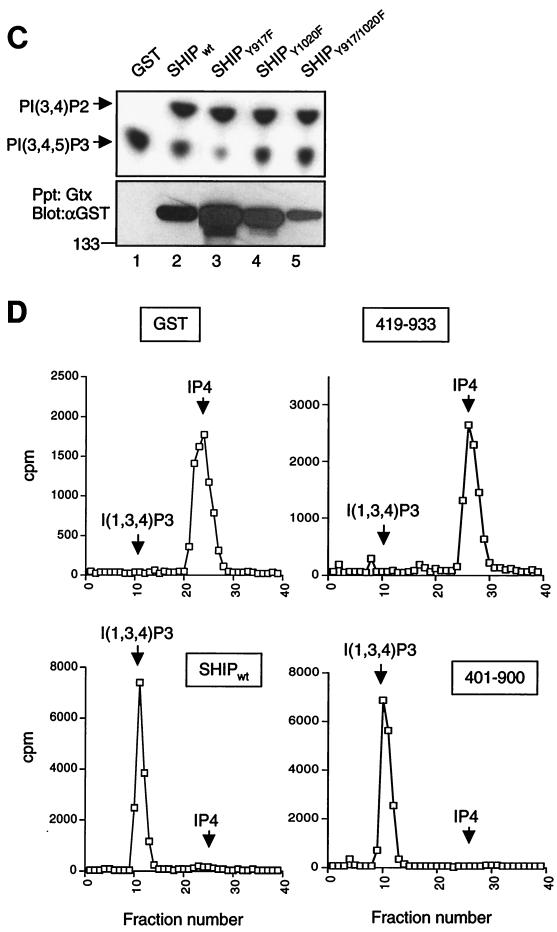
FIG. 1.
Minimal phosphatase region of SHIP. (A) Schematic diagram of the SHIP deletion and truncation mutants. All constructs were GST tagged at the N terminus. The positions of the SH2 domain, IPase signature motifs, and the two Shc-phosphotyrosine binding sites are indicated. The IPase activity of each construct, based on the data shown in panel B, is shown. (B) 293T cells were transfected with the indicated constructs, and the expressed proteins were precipitated with glutathione-Sepharose beads. One half of the beads were assayed for phosphatase activity toward 32P-labeled PIP3 and analyzed by thin-layer chromatography (upper panel). The other half was analyzed for protein expression by immunoblotting with an anti-GST antibody (lower panel). Sizes are shown in kilodaltons. (C) Phosphatase activity of GST-tagged tyrosine mutants of SHIP expressed in 293T cells and precipitated with glutathione-Sepharose beads. The lower panel shows the immunoblot of precipitated proteins with anti-GST antibody. (D) Phosphatase activity of wt and mutant SHIP proteins toward soluble IP4. Proteins precipitated, after transient expression in 293T cells, were incubated with 3H-labeled IP4, and the reaction products were analyzed by FPLC as described in the text. Arrows indicate the peaks for substrate (IP4) and the product inositol-1,3,4-trisphosphate.


