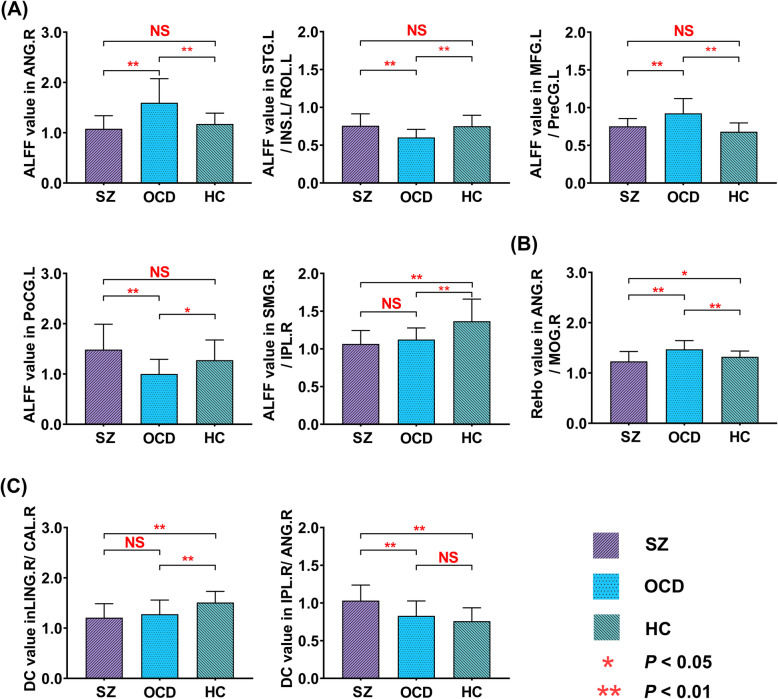
Fig. 2.
Histogram plots illustrate the mean ALFF/ReHo/DC values of the clusters showing significant differences among the three groups. (A). The mean ALFF in the ANG. R, STG.L/INS.L/ROL.R, MFG.L/PreCG.L, PoCG. L, and SMG.R/IPL.R among the three groups. (B). The mean ReHo in the ANG.R/MoG.R among the three groups. (C). The mean DC in the ING.R/CAL.R and IPL.R/ANG.R among the three groups. Error bars reflect the SD. Abbreviations: HC, healthy controls; OCD, participants with obsessive-compulsive disorder; SZ, participants with schizophrenia; ALFF, amplitude of low-frequency fluctuation; ReHo, regional homogeneity; DC, degree centrality; NS, nonsignificance; ANG. R, right angular gyrus; STG.L/INS.L/ROL.L, left superior temporal gyrus/insula/rolandic operculum; MFG.L/PreCG.L, left middle frontal gyrus/precentral gyrus; PoCG. L, left postcentral gyrus, SMG.R/IPL.R, right supramarginal gyrus/inferior parietal lobule; ANG.R/MoG.R, right angular gyrus/middle occipital gyrus; ING.R/CAL.R, right lingual gyrus/ calcarine fissure and surrounding cortex; IPL.R/ANG.R, right inferior parietal lobule/ angular gyrus

