Figure 1.
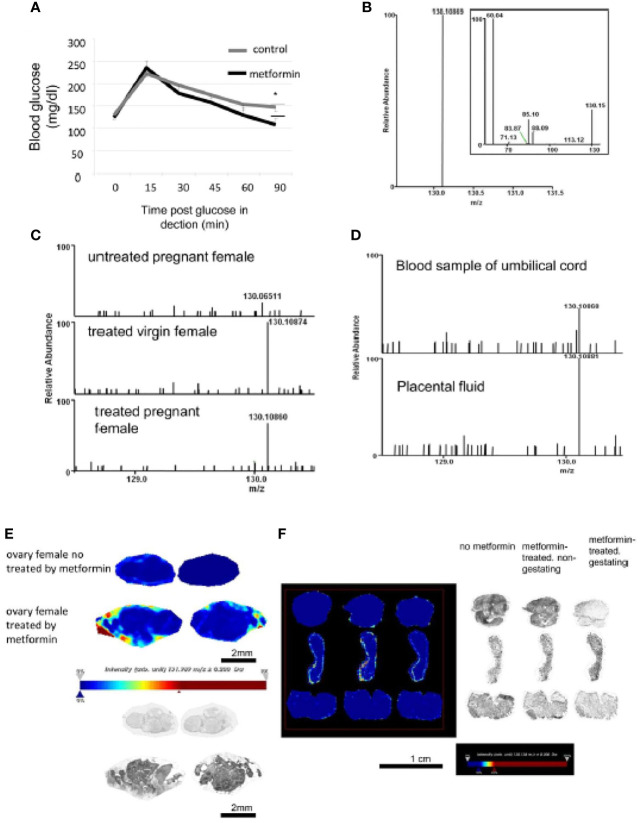
Detection of metformin in biological fluids of metformin-treated mothers by selected ion monitoring (SIM) mass spectrometry (MS). (A) An OGTT test was performed on E10 pregnant mice treated or not with metformin in drinking water. Values are expressed as mean ± SEM (ctrl n=6 vs met n=7). *p < 0.05. (B) High-resolution selected ion monitoring (SIM) spectrum of metformin standard, showing the [M+H]+ ion at m/z 130.1 (δmass = -0.26 ppm, theoretical mass 130.10972 computed from molecular formula C4H12N5). Inset shows the MS/MS spectrum of metformin. (C) SIM spectra of extracts from the blood samples of untreated pregnant female (top), metformin-exposed virgin female (middle, δmass = 0.14 ppm), and metformin-exposed pregnant female (bottom, δmass = 0.94 ppm). The m/z on all spectra are normalized relative to the intensity of the major peak in the scan range of m/z 128.5-131.5 (in this case, the [M+H]+ of metformin). (D) SIM spectra of extracts from blood recovered from umbilical cord (top, δmass = -0.32 ppm) and placental fluid (bottom, δmass = -0.68 ppm). (E) MS imaging of ovary from the mother mice. Image acquired at 30 μm spatial resolution. Pictures showed metformin signal (m/z 130.1) and intensity values are expressed in arbitrary units (a.u.) normalized against the total ion count with a low intensity in blue staining to high intensity in red staining as observed in the intensity bar below the picture. Picture with brightness are in the lower panel. Scale bar 2 mm. (F) MS imaging of uterus from mother mice non-exposed to metformin or non-pregnant or pregnant metformin-exposed female. Pictures showed metformin signal (m/z 130.1) and intensity values are expressed in arbitrary units (a.u.) normalized against the total ion count as observed in the intensity bar below the picture. Picture with brightness is in the right panel. Scale bar 1 cm. We can note an absence of metformin on both uterus samples.

