
Figure 10.
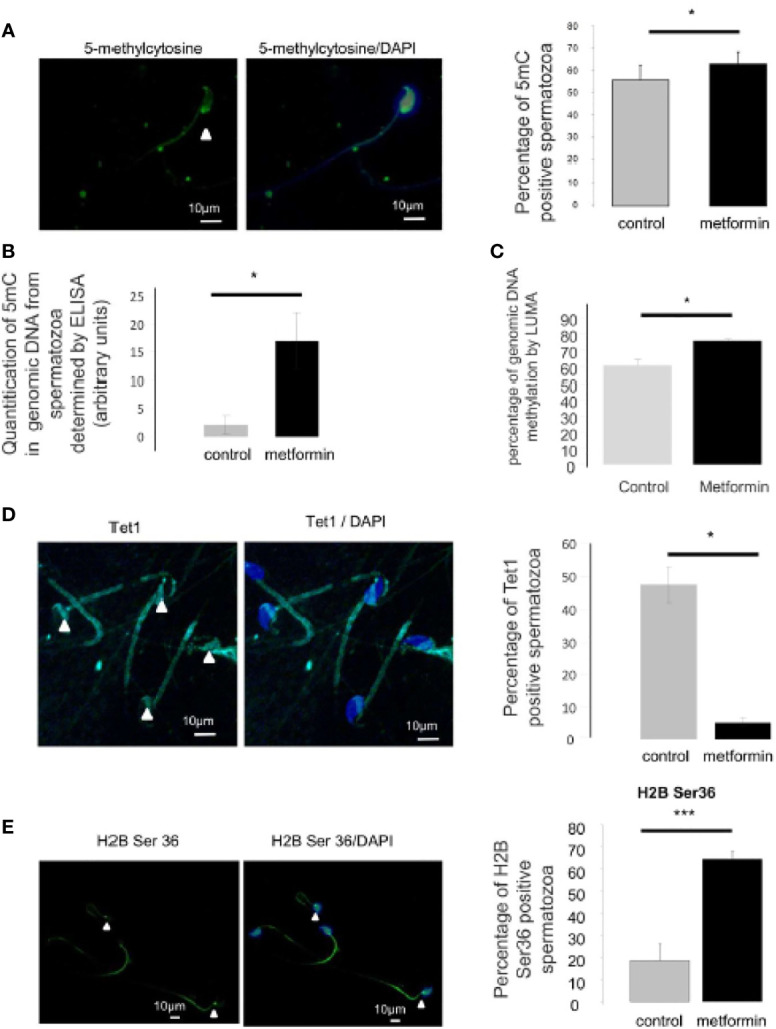
Analysis of epigenetic mark in spermatozoa. (A) Immunocytochemistry (green) against 5 methyl-cytosine in spermatozoa. Nucleus was stained with DAPI (blue). Quantification is shown on the right side of the micrographs (n=4 mice, at least 100 spermatozoa per individual were counted). Scale bar = 10 µm. (B) Percentage of 5mC in genomic DNA from spermatozoa was measured by ELISA assay and (C) percentage of genomic DNA methylation in epididymis cauda was analysed by LUMA. (D) Immunocytochemistry (green) against TET1 in spermatozoa. Nucleus was stained with DAPI (blue). Quantification is shown on the right side of the micrographs (n=4, at least 100 spermatozoa per individual were counted). Scale bar = 10 µm. (E) Immunocytochemistry (green) against phospho-Ser36-H2B in spermatozoa. Nucleus was stained with DAPI (blue). IgG was used as negative control. Quantification is shown on the right side of the micrographs (n=3-4, at least 100 spermatozoa per individual were counted). Scale bar = 10 µm. Values are expressed as mean ± SEM. *p < 0.05; ***p < 0.001.