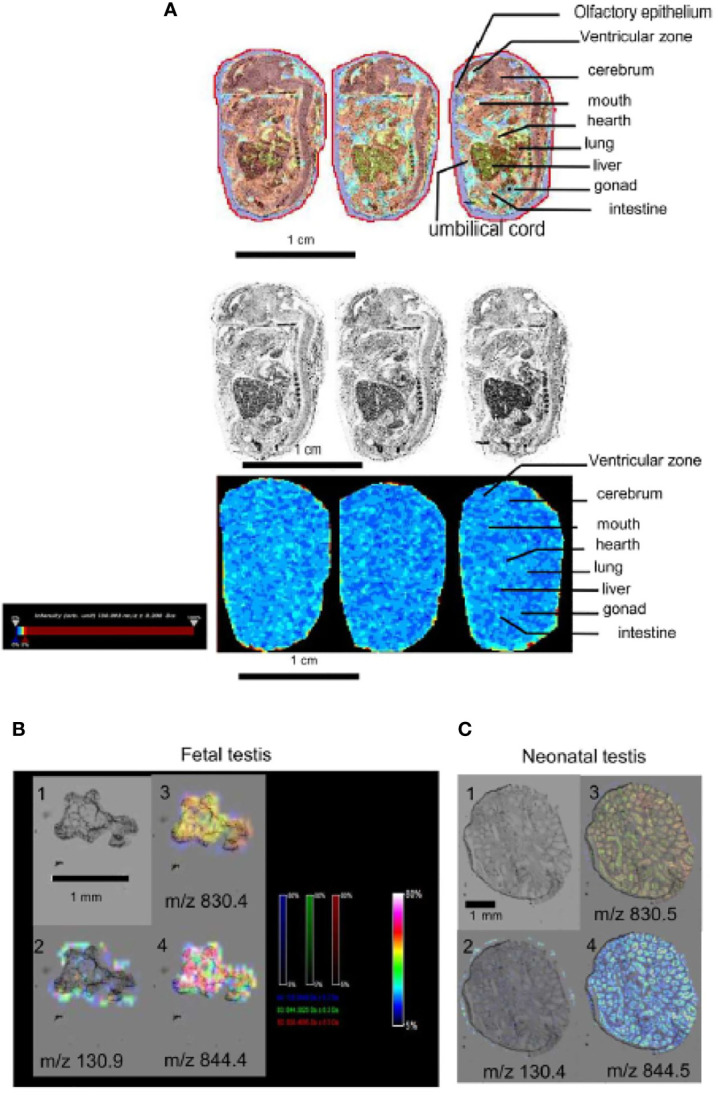
Figure 2.

Detection of metformin in embryo by selected ion monitoring (SIM) mass spectrometry (MS). (A) Upper panel, picture with brightness and artificial color of sagittal section of a mouse embryo (15dpc) from a metformin-treated mother. Lower panel, MS imaging of metformin signal (m/z 130.1), images acquired at 30 μm spatial resolution. Intensity bar to the left of the picture. Scale bar 1 cm. (B) Embryonic testis (15dpc) and (C) neonatal testis (1dpp) exposed to metformin in utero. Panel 1: picture with brightness. Panel 2 pictures showing metformin signal (m/z 130.1). Panel 3 and 4 pictures showing positive signal (lipids) (m/z 830.4 and 844.4). Intensity values are expressed in arbitrary units (a.u.) normalized against the total ion count (low intensity: blue staining, high intensity: red staining), the intensity bar is in the middle of the image panel. We can note an absence of metformin on the testis. Scale bar 1 mm.
