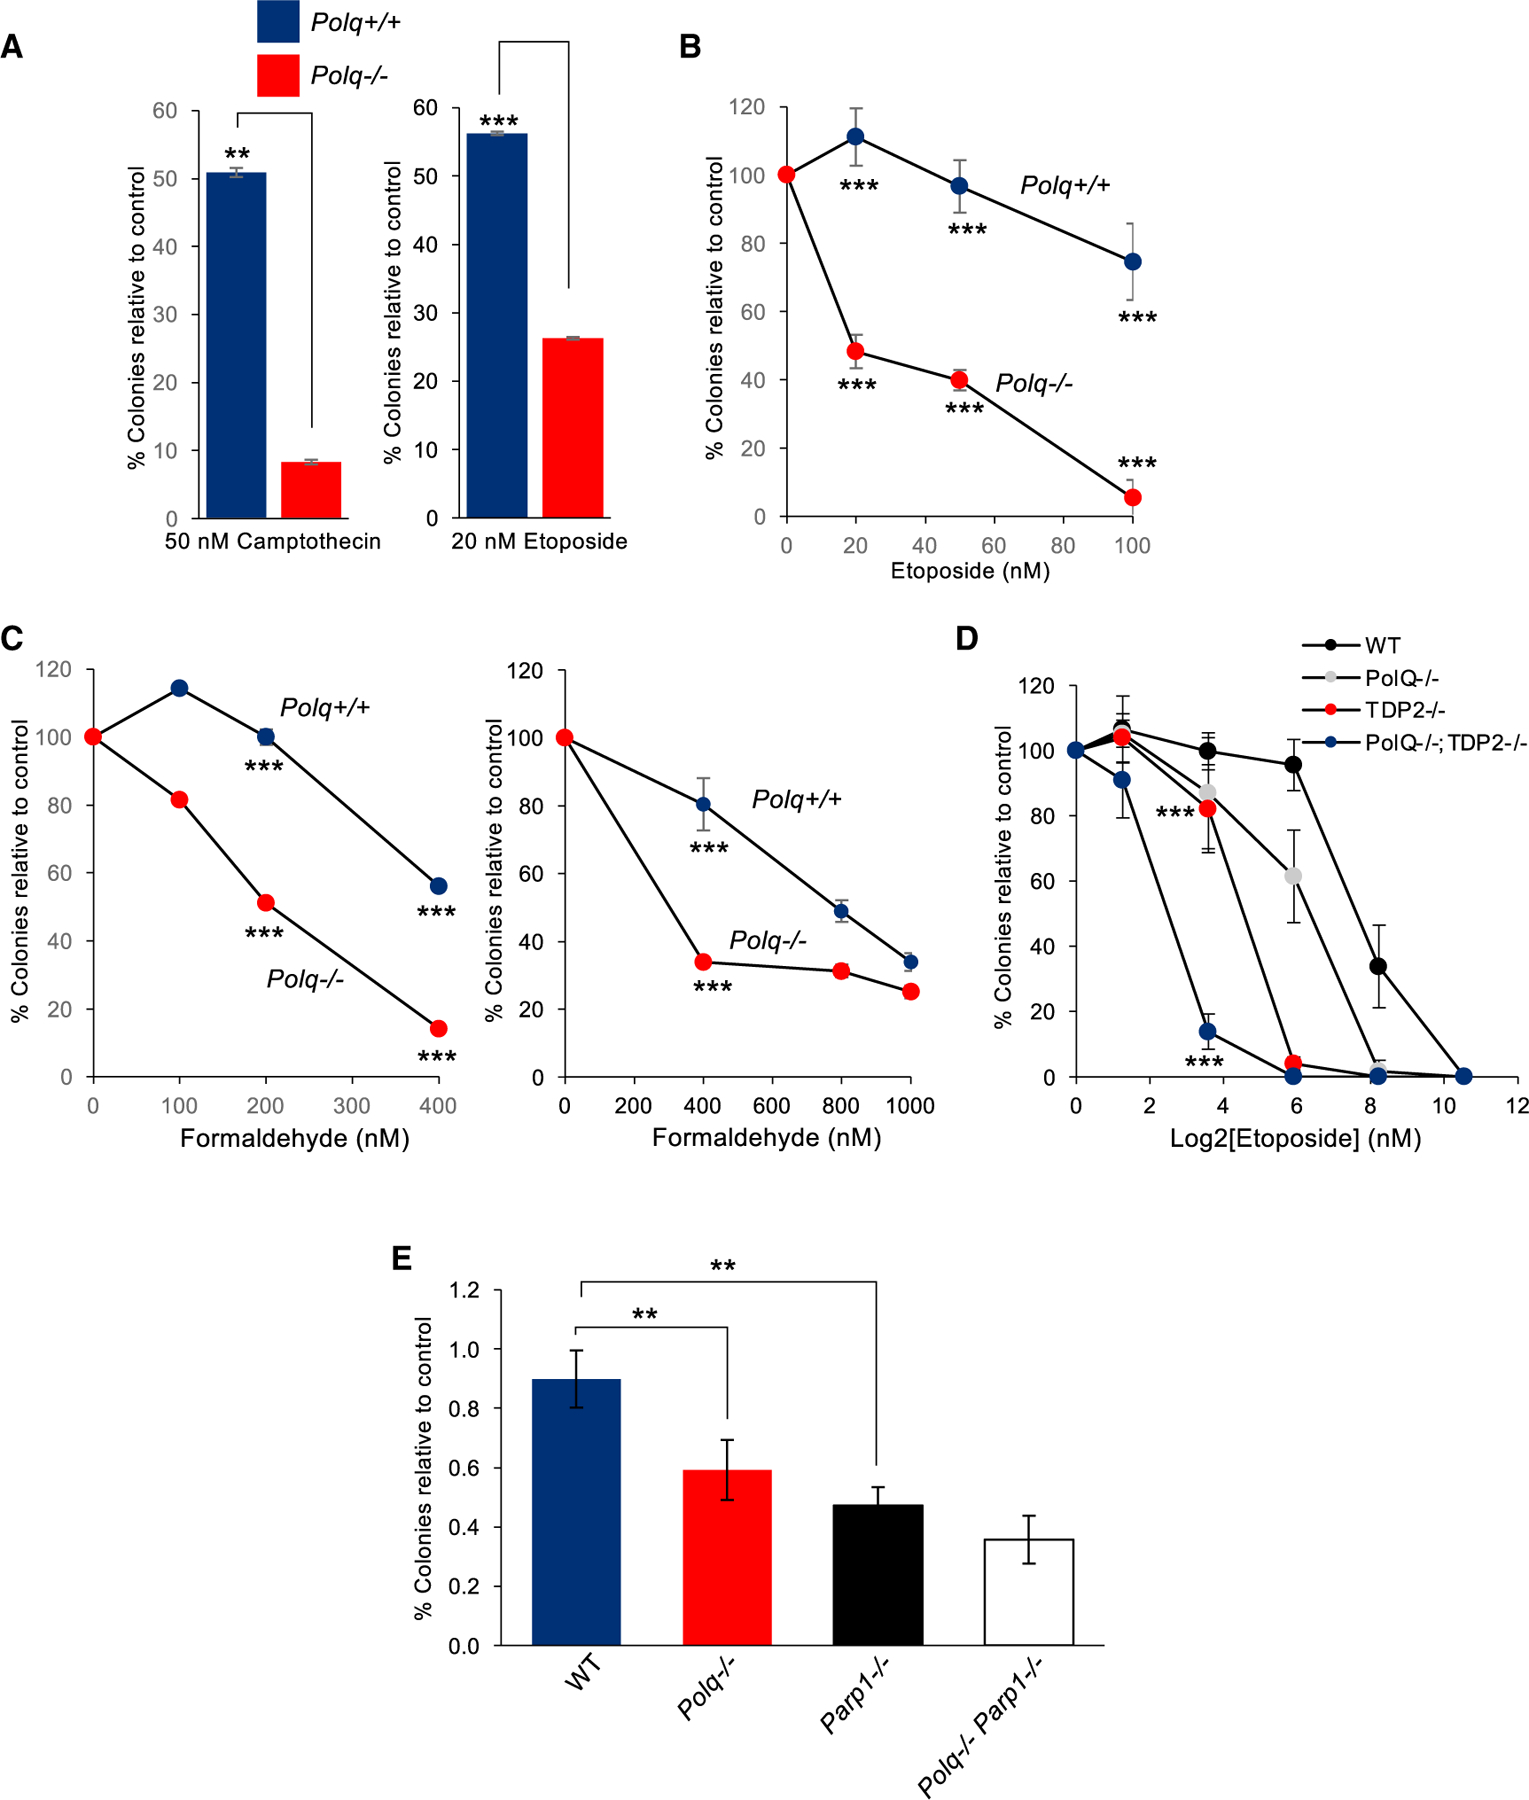
Figure 1. Polθ confers resistance to DNA-protein crosslinking agents.

(A) Bar plots showing percentage of colonies relative to control after treatment with the indicated topoisomerase inhibitors in Polq+/+ and Polq−/− mESCs. Data represent mean. n = 3 ± SEM. *p < 0.05, **p < 0.01, ***p < 0.001. Statistical significance from two-sample t test: p = 0.004 for camptothecin and p = 0.001 for etoposide.
(B) Plot showing percentage of colonies relative to control after treatment with the indicated concentrations of etoposide in Polq+/+ and Polq−/− mouse bone marrow cells. Data represent mean. n = 3 ± SD. *p < 0.05, **p < 0.01, ***p < 0.001. Statistical significance from two sample t test: p = 0.00017 for 20 nM, p = 0.0001 for 50 nM, p = 0.0003 for 100 nM.
(C) Plot showing percentage of colonies relative to control after treatment with indicated concentrations of formaldehyde in Polq+/+ and Polq−/− mESCs (left) and bone marrow cells (right). Data represent mean (n = 3) ± SEM (left), SD. (right). *p < 0.05, **p < 0.01, ***p < 0.001. Statistical significance from two-sample t test: p = 0.001 for 200 nM formaldehyde and p = 0.00001 for 400nM formaldehyde (left). Statistical significance from two-sample t test: p = 0.0002 for 400 nM (right).
(D) Plot showing percentage of colonies relative to control after treatment with indicated concentrations of etoposide in HCT116 cells with indicated gene knockouts. *p < 0.05, **p < 0.01, ***p < 0.001. Statistical significance from two-sample t test: p < 0.00001 for 3.8 nm.
(E) Plot showing colonies normalized to control after treatment with indicated concentrations of etoposide in Polq+/+, Polq−/−, Parp1 −/−, and Polq−/− Parp1−/− mouse bone marrow cells. *p < 0.05, **p < 0.01, ***p < 0.001. Statistical significance from two-sample t test for 50 nm: p = 0.009 for wild-type versus Polq−/−, p = 0.0013 for wild-type versus Parp1−/−, p = not significant for Parp1 −/− versus double null.
