FIGURE 2.

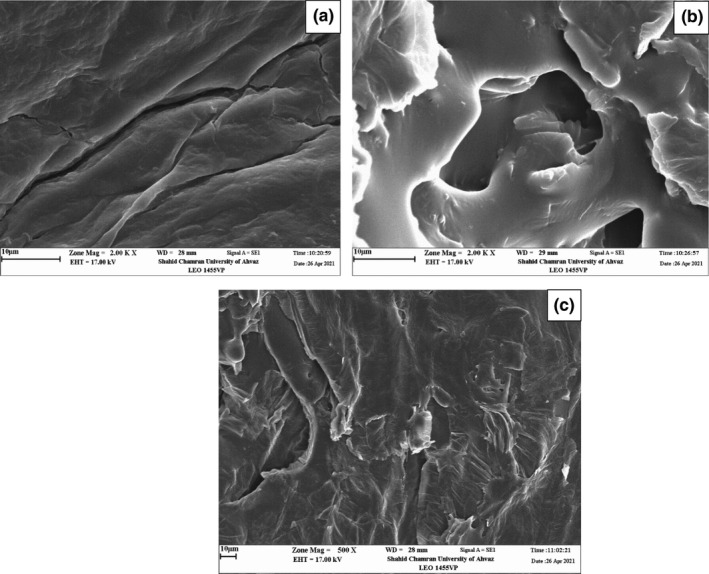
Micrographs of control (a), sample treated with aerosolized citric acid (b), and sample treated with aerosolized citric acid‐RF (c)

Micrographs of control (a), sample treated with aerosolized citric acid (b), and sample treated with aerosolized citric acid‐RF (c)