FIGURE 3.

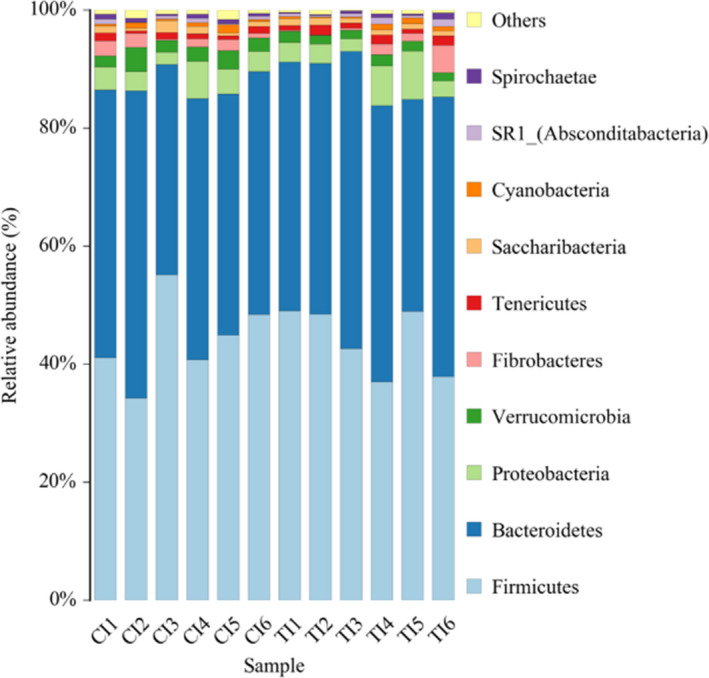
Effects of total mixed ration with various forage silage on bacterial abundance in phylum level. CI: Represents the six samples of the SS group; TI: Represents the six samples of the MS group

Effects of total mixed ration with various forage silage on bacterial abundance in phylum level. CI: Represents the six samples of the SS group; TI: Represents the six samples of the MS group