FIGURE 1.

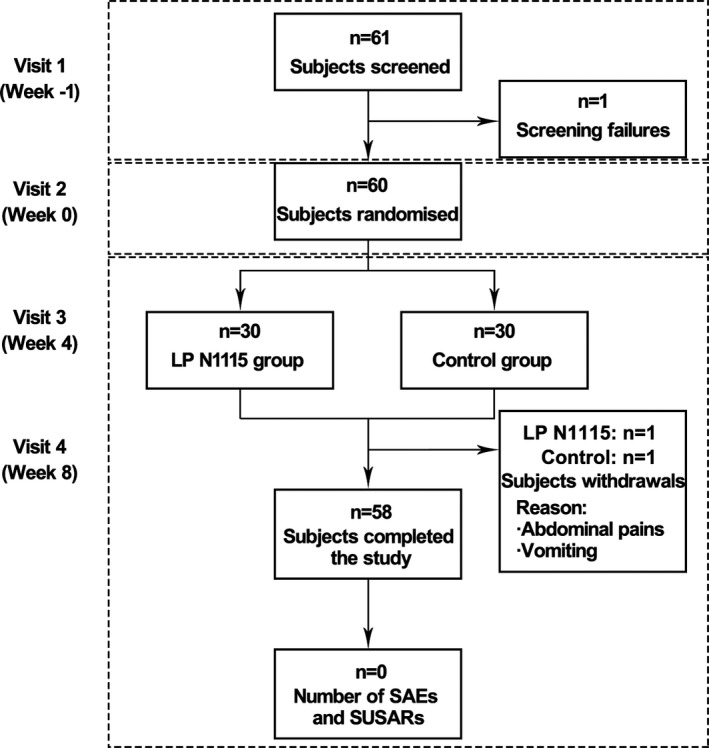
A flow chart showing disposition of subjects. The study involved four visits over an 8‐week period. Values are expressed as the number of subjects. SAEs, Serious adverse events; SUSARs, Suspected Unexpected serious adverse reactions

A flow chart showing disposition of subjects. The study involved four visits over an 8‐week period. Values are expressed as the number of subjects. SAEs, Serious adverse events; SUSARs, Suspected Unexpected serious adverse reactions