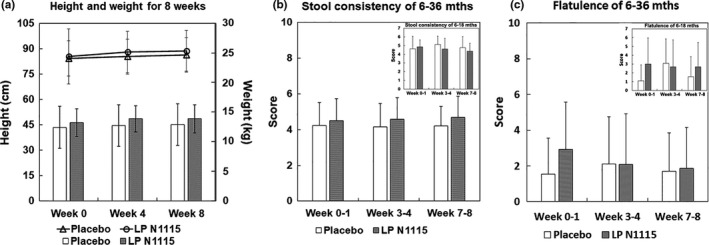
FIGURE 2.

The anthropometrics and intestinal movements of subjects. (a) The height (line chart used the left vertical axis) and weight (histogram used the right axis) of subjects in both groups showed no significant differences. (b, c) The scores of stool consistency and flatulence were calculated based on daily symptom diary. Both of them revealed no significant differences, so were the results in the 6–18 months subgroup shown in the upper right corner of each histogram
