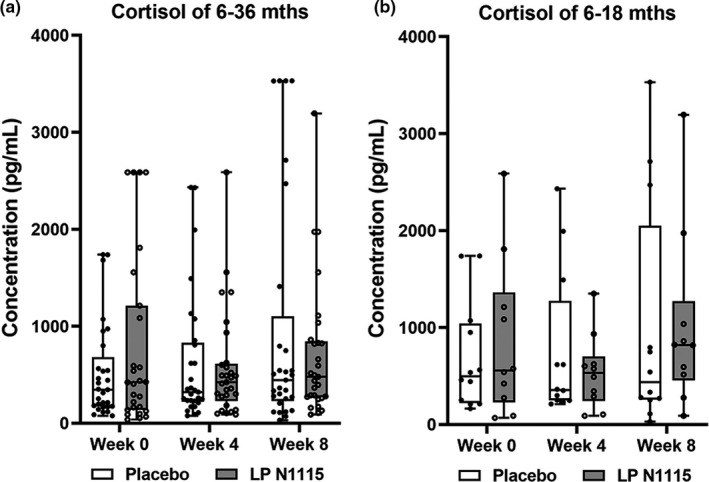
FIGURE 3.

Salivary cortisol values (pg/ml) for both LP N1115 and placebo groups according to the different age groups. (a) Cortisol levels were assessed at baseline, week 4 and week 8 which showed no significant difference between two groups (p > .05). (b) Cortisol levels at the same three time points also showed no significant differences in the 6–18 months subgroup (p > .05). Hollow dots represent data of each subjects in the placebo group, and solid dots are data in LP N1115 group
