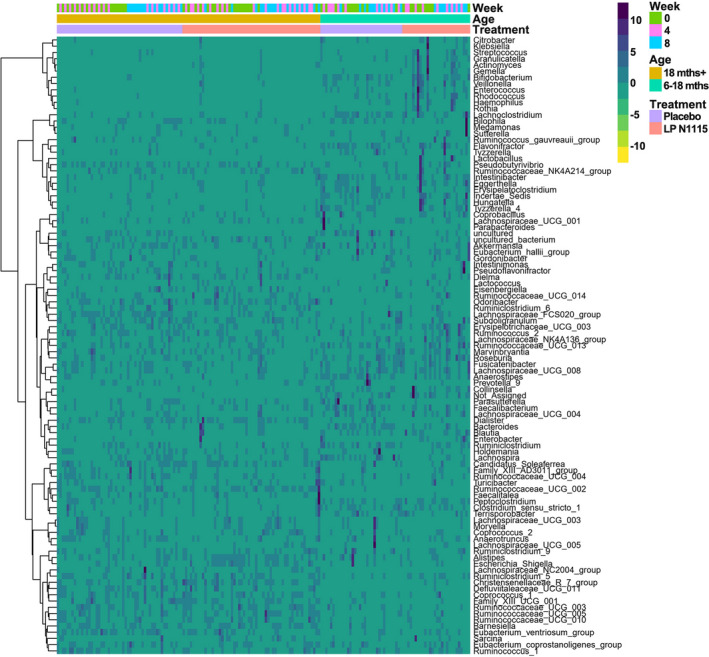
FIGURE 5.

A Hierarchical clustering heat map of microbiota associated with treatment (including LP N1115 group in indy pink and the placebo group in lilac), age (including 6–18 months subgroup in cyan and 18 months+ subgroup in ginger) and time (including week 0 in olive green, week 4 in pink and week 8 in blue) based on Euclidean distance measure and Ward clustering algorithm. Values range from low (yellow) to high (navy)
