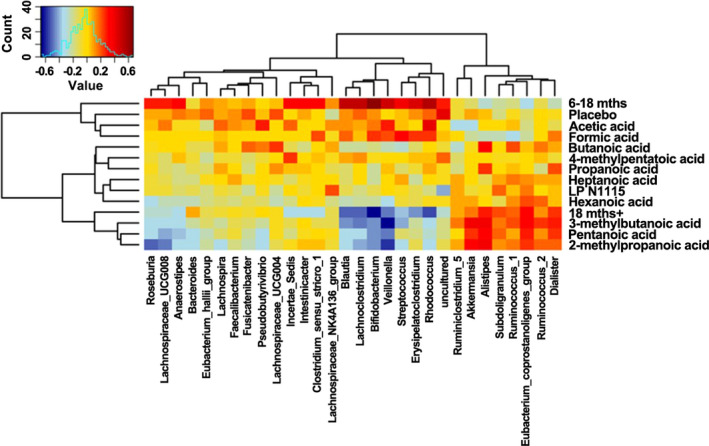
FIGURE 6.

Spearman correlation heat map between SCFAs and relative abundances of fecal microbiota at the genus level from subjects based on both LP N1115 and placebo groups post‐intervention. Values range from low (blue) to high (red)

Spearman correlation heat map between SCFAs and relative abundances of fecal microbiota at the genus level from subjects based on both LP N1115 and placebo groups post‐intervention. Values range from low (blue) to high (red)