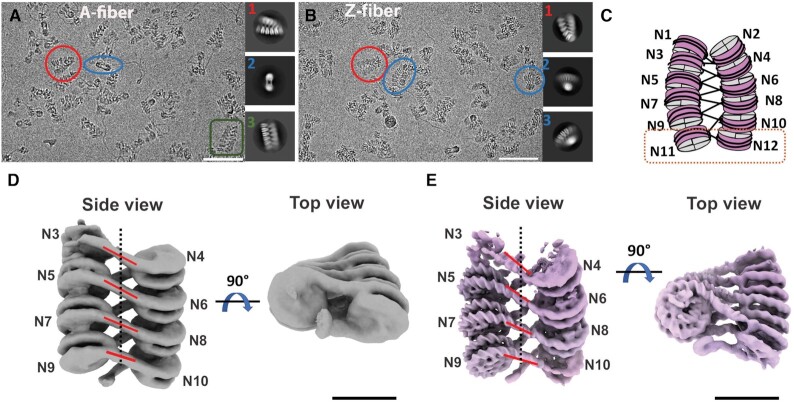
Figure 4.
Cryo-EM structures of chromatin fibers containing H2A.Z and H2A nucleosomes. (A) Representative micrographs of vitreous sample of H2A fiber with selected 2D classes. Particles that share the same view as the 2D classes are color coded the same way and highlighted with either a circle or a square. Scale bar = 25 nm. (B) Representative micrographs of vitreous sample of H2A.Z fiber with selected 2D classes. Scale bar = 25 nm. (C) Schematic of dodeca-nucleosome fiber. A di-nucleosome structural unit is highlighted in an orange square. (D) cryo-EM map of multi-body refined H2A fiber, side and top view; Nucleosome 3 to 10 are shown. Linker DNAs are highlighted with red lines and the fiber axis is shown as a dotted line. Scale bar = 10 nm. Resolution of individual nucleosome ranged from 10 to 14.8 Å. (E) cryo-EM map of multi-body refined H2A.Z fiber, side and top view. Scale bar = 10 nm. Resolution of individual nucleosome ranged from 7.5 to 12.5 Å.

