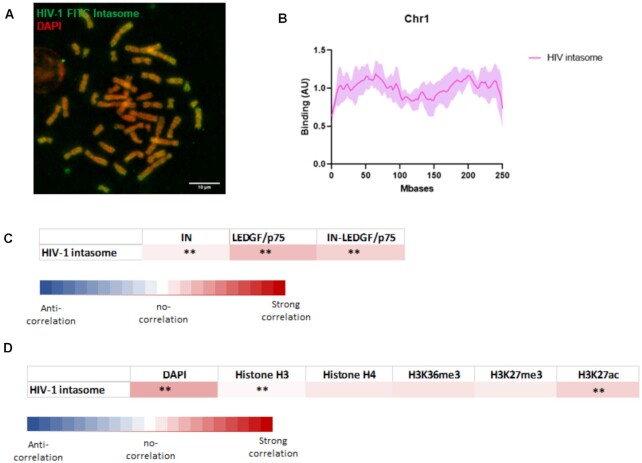
Figure 7.
Analysis of the chromatin binding property of HIV-1 intasome. HIV-1 intasome was assembled using IN, LEDGF/p75 and the viral short DNA sequence corresponding to the viral end tagged with FITC. The intasome was purified by size exclusion chromatohraphy (see S8). After verification of their functionality in in vitro concerted integration assays the intasome (4nM) were incubated with chromosomes spreads. Interaction profile was determine by FITC-epifluorescence acquisitions (A). The distribution profile onto chromosome 1 was compared determined as reported in materials and methods section (an example of chromosome 1 is reported in (B), see the profile of chromosome 2 and 3 in S9). The data are reported as means from the quantification of eight to nine chromosomes ± standard deviation (SD). Scale bar = 10 μM. Correlation between the distributions of the intasome and the distribution of IN alone, LEDGF/p75 alone or IN-LEDGF/p75 complex (C) as well as DAPI staining, H3/H4, H3K36me3, K3K27me3 and H3K27ac (D) was compared. The mean and standard deviation of the Pearson correlation calculation (>0 for a positive correlation, =0 for no correlation and <0 for negative correlation) were performed between all paired protein distribution and DAPI/histone curves. The P-value (Wilcoxon rank sum test) at each position and the percentage of pairs with P < 0.01 was also calculated and were reported as *** if > 0.80 and ** if > 0.40).

