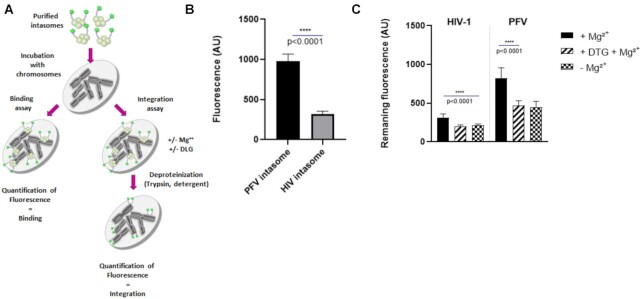
Figure 8.
Analysis of the chromatin binding and integration efficiency of HIV-1 and PFV intasomes. Chromosomes spreads were used either to quantify the direct intasome binding or the integration efficiency (A). After incubation with intasome (5 nM) under binding conditions the fluorescence was quantified on nine chromosomes and reported as means ± SD (B). Exposition was adjusted to 2000 ms for HIV-1 and 1500 ms for PFV. For quantification of the integration efficiency, after incubation with intasomes under conditions allowing integration, samples were then treated with trypsin and washed extensively with Triton X-100. The remaining fluorescence was then quantified by epifluorescence in each conditions ± Mg2+ or dolutegravir 1 μM (DTG). Data are reported in (C) as mean of fluorescence from eight chromosomes ± standard deviation (SD).

