Figure 2.
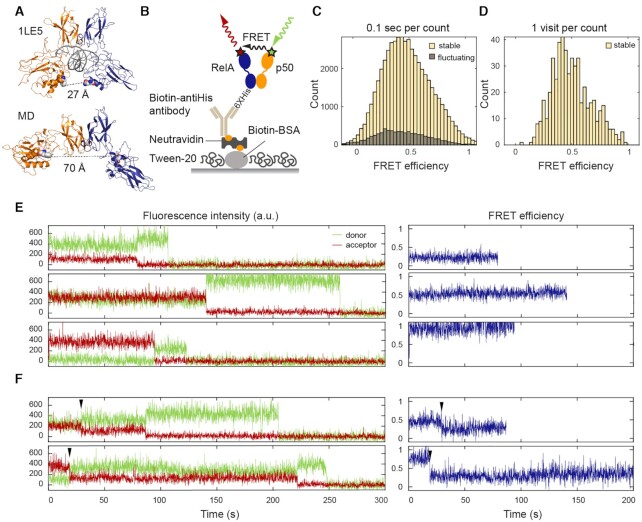
smFRET revealed a continuum of long-lived conformations for free NF-κB. (A) In the NF-κB/DNA structure (PDB: 1LE5), the distance between the labeled positions (spheres) would lead to a high FRET efficiency ∼1. In MD simulations, free NF-κB could adopt an open conformation, leading to a low FRET efficiency ∼0.1. (B) Schematic of NF-κB immobilization on a DT20 passivated surface. (C) FRET histogram showing a broad distribution of conformations. The histogram was constructed by counting every 0.1 s time window in the first 10 s of all traces. (D) FRET histogram constructed by counting each visit to a long-lived state suggested a continuum that cannot be separated into a few groups. (E) Representative long-lived states with low, mid and high FRET efficiencies. Sudden drops of the donor or acceptor signals to zero indicate single photobleaching events. (F) Transitions (arrowhead) between long-lived states were captured in a subset of traces.

