Figure 4.

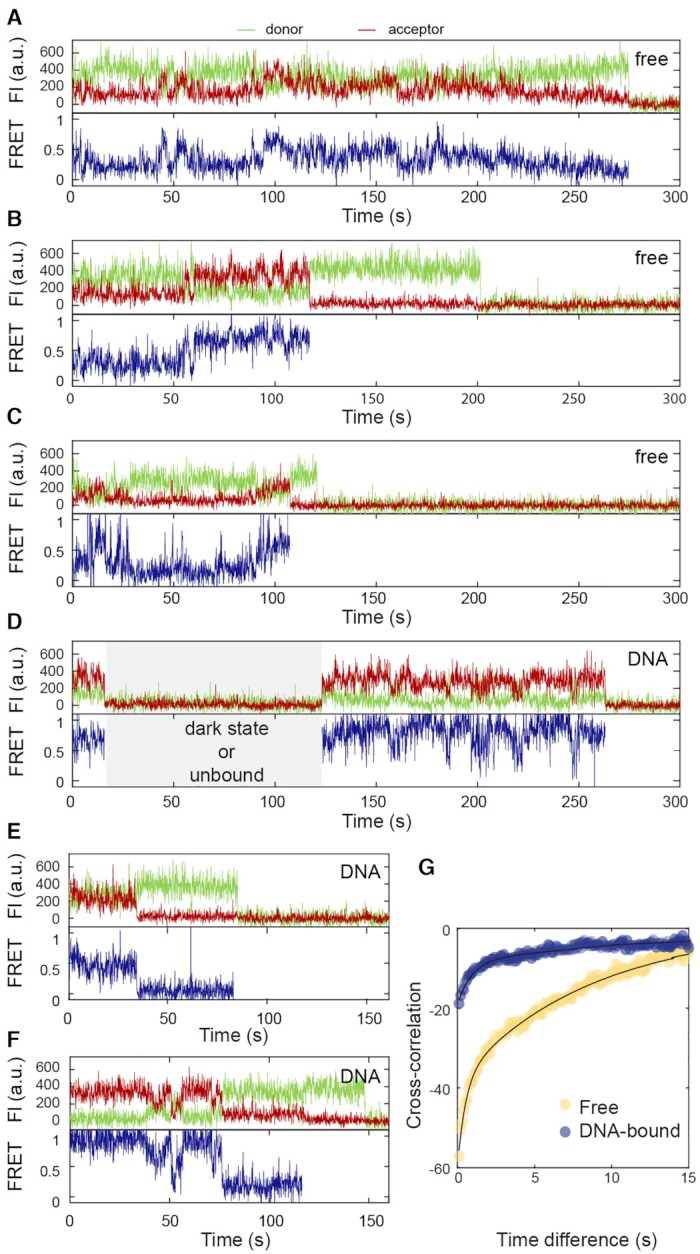
Interdomain motions of free and DNA-bound NF-κB on the seconds timescale. (A) A representative fluctuating trace for free NF-κB with fluctuations connecting low- and high- FRET states, which corresponds 30–70 Å in the interdomain distance. (B) A trace for free NF-κB with small fluctuations around a low-FRET state at first. At 60 s, the molecule transitioned to a high-FRET state and fluctuated around it. (C) A trace with transitions between fluctuations and long-lived states for free NF-κB, suggesting all the conformational states are interconvertible. (D and E) Representative fluctuating traces of DNA-bound NF-κB showing small fluctuations. The time period with no signals (gray area) could be caused by a donor dark state, an unbound state, or a state in which an unlabeled NF-κB is bound to the immobilized DNA, and does not affect data interpretation. (F) A trace with transitions between fluctuating and long-lived states for DNA-bound NF-κB. (G) Cross-correlation analyses for fluctuations of free (yellow) and DNA-bound (blue) NF-κB showing that the interdomain motions of the DNA-bound NF-κB have lower amplitudes and slower rates. Biexponential fitting revealed the characteristic fluctuation time to be 0.50 ± 0.08 s and 8.4 ± 0.7 s for free NF-κB and 0.91 ± 0.16 s and 17 ± 3 s for DNA-bound NF-κB.
