Figure 9.
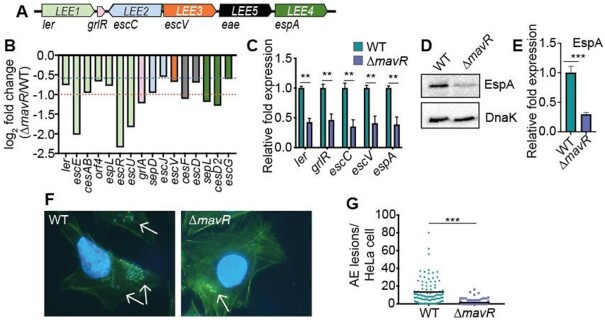
MavR is required for maximal LEE gene expression and AE lesion formation. (A) Schematic of the LEE. (B) RNAseq data comparing LEE gene expression in ΔmavR compared to WT under microaerobic conditions; N = 3. Columns are color-coded according to operon (shown in (A)). The red dotted line indicates 2-fold change, and the blue dotted line indicates 1.5-fold change. (C) RT-qPCR of LEE genes in WT and ΔmavR; N = 3. (D) Western blot of EspA expression in the WT and ΔmavR. DnaK is the loading control. (E) Quantification of EspA expression in the WT and ΔmavR. (F) FAS assay showing AE lesions on HeLa cells infected with WT or ΔmavR. AE lesions are indicated by arrows. (G) Quantification of AE lesions on HeLa cells infected with WT or ΔmavR. N = 98–120 HeLa cells. Bars represent the mean and error bars indicate SEM. ** P < 0.01, *** P < 0.001 (Student’s two-sample t-test).

