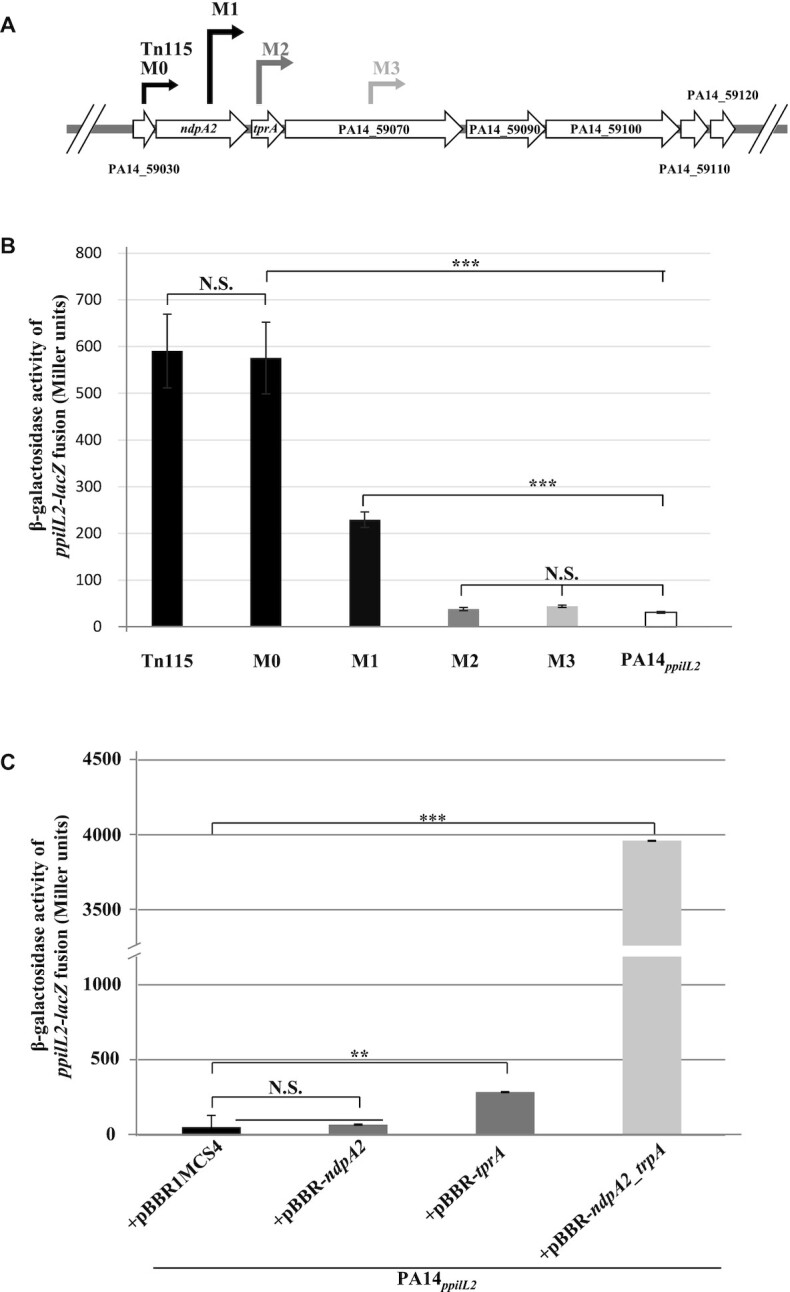
Figure 2.

Identification of NdpA2 and TprA as regulators of pil2 operon expression. (A) Position of the mariner transposon inside the PA14_59000–120 locus in Tn115, M0, M1, M2 and M3 strains. The beginning of the arrow indicates where the transposon has been inserted (the exact position is shown in Supplementary Table S3) and the tip of the arrow represents the ptac promoter orientation. (B) Expression of the chromosomal ppilL2-lacZ fusion, monitored in the PA14ppilL2, Tn115, M0, M1, M2 and M3 strains. (C) The impact of ndpA2 or tprA overexpression on ppilL2-lacZ fusion in PA14ppilL2. For panels B and C, strains grew in LB and the ppilL2-lacZ fusion activities were evaluated when cells reached the early stationary phase (8 h). Data are expressed in Miller units and correspond to the mean values (with error bars) obtained from three independent experiments. Wilcoxon-Mann-Whitney tests were performed, and N.S., *, ** and *** indicate non-significant, P < 0.05, P < 0.01 and P < 0.001, respectively.
