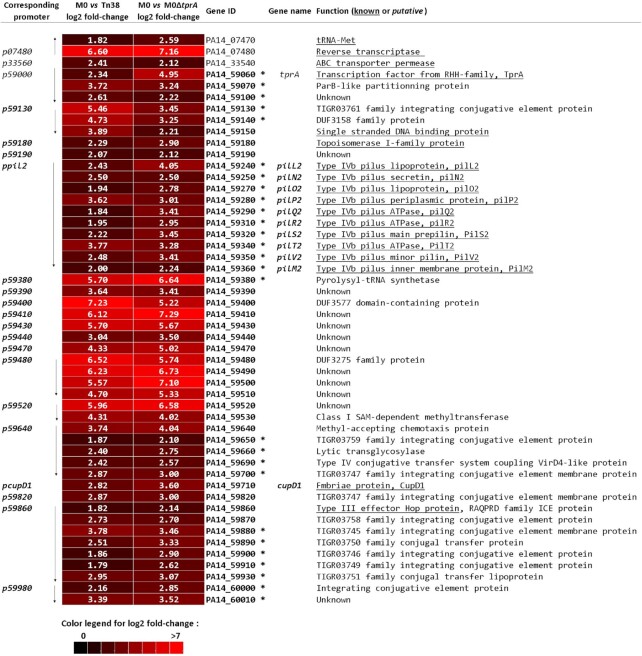
Figure 6.
Genes differentially regulated by ndpA2 and tprA overexpression (M0 strain) versus non-overexpressing strain (Tn38 strain) or versus the strain with inactivated tprA gene (M0ΔtprA strain). The colour chart, at the bottom of the figure, illustrates the expression level of each gene based on an average of two experiments (see Materials and Methods). Red indicates the induced genes in M0 according to the colour chart. The log2fold-change in mRNA levels (M0/Tn38; column 2) or (M0/M0ΔtprA; column 3) are indicated for each gene by the white number in the boxes. Genes are identified by their unique ID (Gene ID) and by their gene name. Genes are listed in chromosomal order to illustrate the transcriptional units. The transcription direction is indicated by an arrow. Genes in bold are located within ICE PAPI-1 and essential genes for PAPI-1 transfer (11,12) are indicated by an *. The function of the genes, known (underlined) or putative, are provided in column 6.

