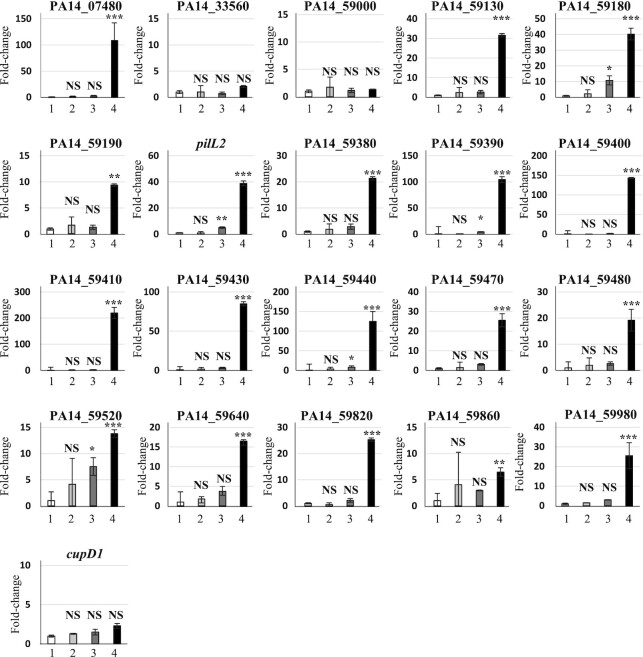
Figure 7.
Validation of differentially expressed genes by TprA and NdpA2. qRT-PCR were performed in triplicate (see Materials and Methods) on the first gene of each transcription unit detected as being differentially expressed by our microarray experiments (see Figure 6). The identifies are 1: PA14 + pBBR1MCS4, 2: PA14 + pBBR-ndpA2, 3:PA14 + pBBR-tprA, 4: PA14 + pBBR-ndpA2_tprA. The Y-axis represents the relative fold change between PA14 + pBBR1MCS4 and the other strains. Data were analysed using REST software in which significant differences are determined by an ANOVA using approximate tests (34). *, **, *** and NS indicate P < 0.05, P < 0.01 and P < 0.001 and a non-significant difference, respectively.

