Figure 5.
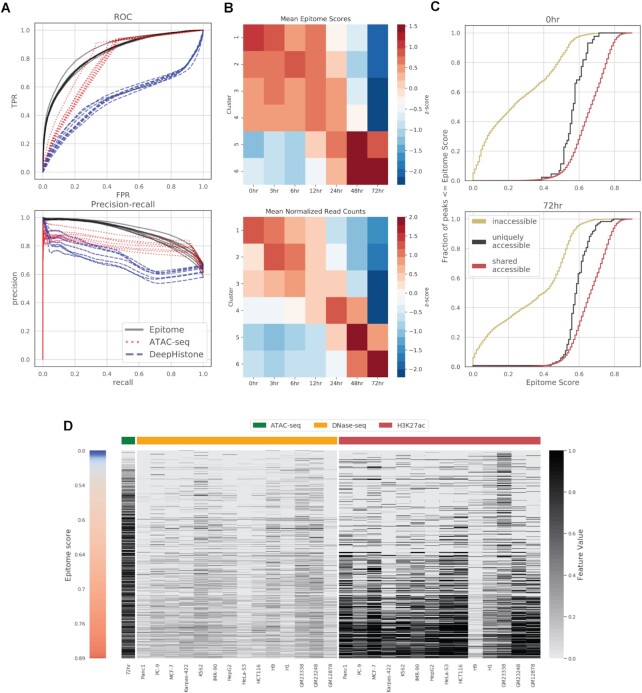
Epitome detects differential H3K27ac across seven time points in neural differentiation from human pluripotent stem cells. (A) ROC and PR curves for predictions of H3K27ac peaks using three methods: Epitome, an ATAC-seq enrichment baseline predictor, and DeepHistone, at seven time points of neural differentiation. (B) (Top) Mean Epitome scores of H3K27ac peaks across seven time points in six clusters from 2400 temporal peaks (54). (Bottom) Mean normalized H3K27ac read counts across seven time points in six clusters. Rows are standardized. (C) CDFs of Epitome scores for H3K27ac peaks at 0 and 72 h in regions that are uniquely accessible to a timepoint (black), are inaccessible for a timepoint (yellow) and have shared accessibility across all timepoints (red). Both 0 and 72 h timepoints have low scores in inaccessible regions. Regions of unique and shared accessibility have and moderate and strong scores, respectively. (D) Heatmap of features used by the Epitome model for 25 762 genomic regions containing H3K27ac peaks at 72 h. Yellow and red columns indicate binary peaks for DNase-seq and H3K27ac, respectively, used as features from reference cell types. ATAC-seq column, labeled in green, indicates presence of absence of ATAC-seq peaks in the 72 h time point. Color bar on left represents Epitome scores, where blue represents instances of false negatives and red represents instances of true positives.

