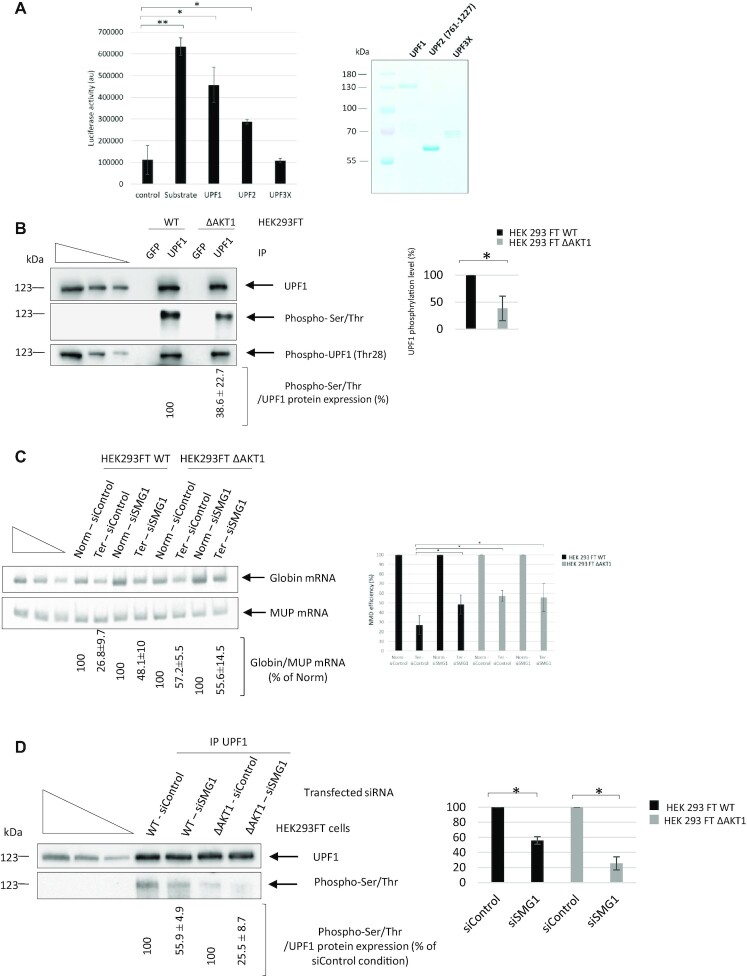
Figure 7.
AKT1 phosphorylates NMD factors. (A) In vitro phosphorylation of UPF1 and UPF2 (761-1227) but not UPF3X by AKT1. Error bar = S.D., P-values were calculated with Student's t-test: *<0.05. The right panel is a Coomassie staining gel showing the UPF proteins used in the assay. (B) UPF1 was immunoprecipitated from HEK293FT WT and HEK293FT ΔAKT1 cells to assess the level of UPF1 phosphorylation. The three leftmost lanes of each panel of the figure correspond to serial dilutions of HEK293FT whole cell extract. The right panel shows quantification of UPF1 phosphorylation in both cell lines after immunoprecipitation of UPF1. (C) Absence of any additive effect of AKT1 and SMG1 on NMD efficiency. SMG1 was downregulated with siRNA in HEK293FT WT and HEK293FT ΔAKT1 cells expressing Globin Norm or Globin Ter in order to evaluate the NMD efficiency. The NMD efficiency was measured by RT-PCR. The left panel shows a representative gel analysis after quantitative PCR. MUP mRNA was used as a loading and transfection control. The three leftmost lanes correspond to serial dilutions of the Norm control plasmid sample. The bar plot on the right side of the gel shows the NMD efficiencies measured under the different tested conditions. (D) Measurement of UPF1 phosphorylation in HEK293FT WT and HEK293FT ΔAKT1 cells in the presence and absence of SMG1. The left panel shows a representative gel analysis and the bar plot on the right side of the gel is a graphic illustration of the quantification of two independent experiments. The three leftmost lanes of each panel of the figure correspond to serial dilutions of HEK293FT whole cell extract. Error bar = S.D., P-values were calculated with Student's t-test: *<0.05. The in vitro phosphorylation and immunoprecipitation results are representative of two and three experiments, respectively. The RT-PCR results showing the effects of SMG1 and AKT1 kinases are representative of four experiments.

