Figure 8.
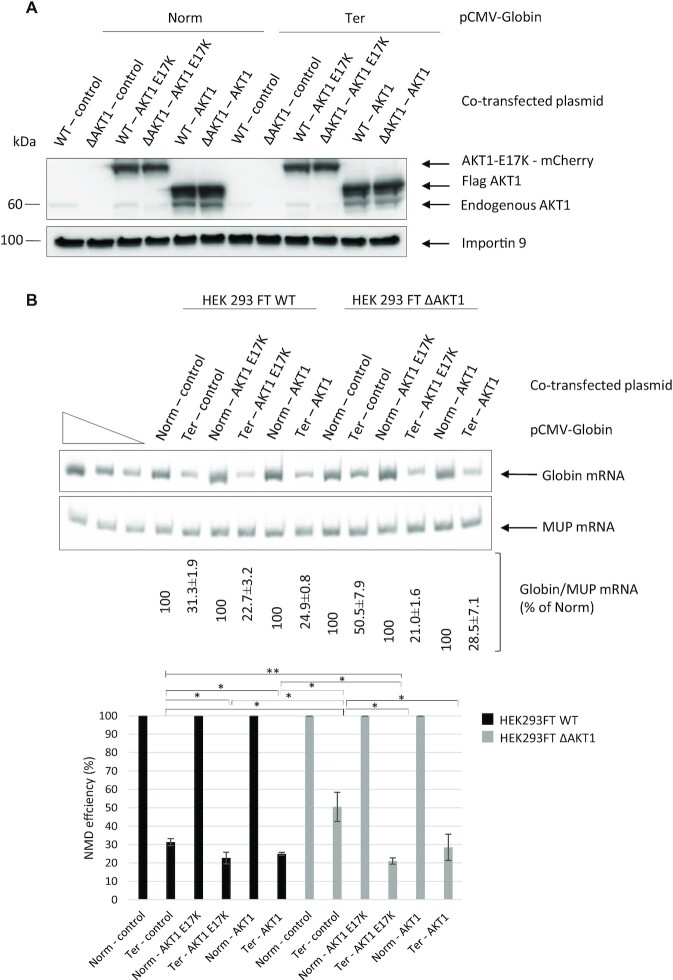
The NMD efficiency is related to the AKT1 activation status. (A) Western blot analysis showing levels of the endogenous, plasmid-encoded WT, and plasmid-encoded constitutively activated (E17K) AKT1 isoforms. Importin 9 was used as a loading control. (B) NMD efficiency measured by RT-PCR. The upper panel shows a representative gel analysis after quantitative PCR. MUP mRNA was used as a loading and transfection control. The three leftmost lanes correspond to serial dilutions of the Norm control plasmid sample. The bar plot at the bottom of the figure shows the NMD efficiencies measured under the different test conditions. Error bar = S.D., P-values were calculated with Student's t-test: *<0.05, **<0.01. All the results of this figure are representative of three experiments.

