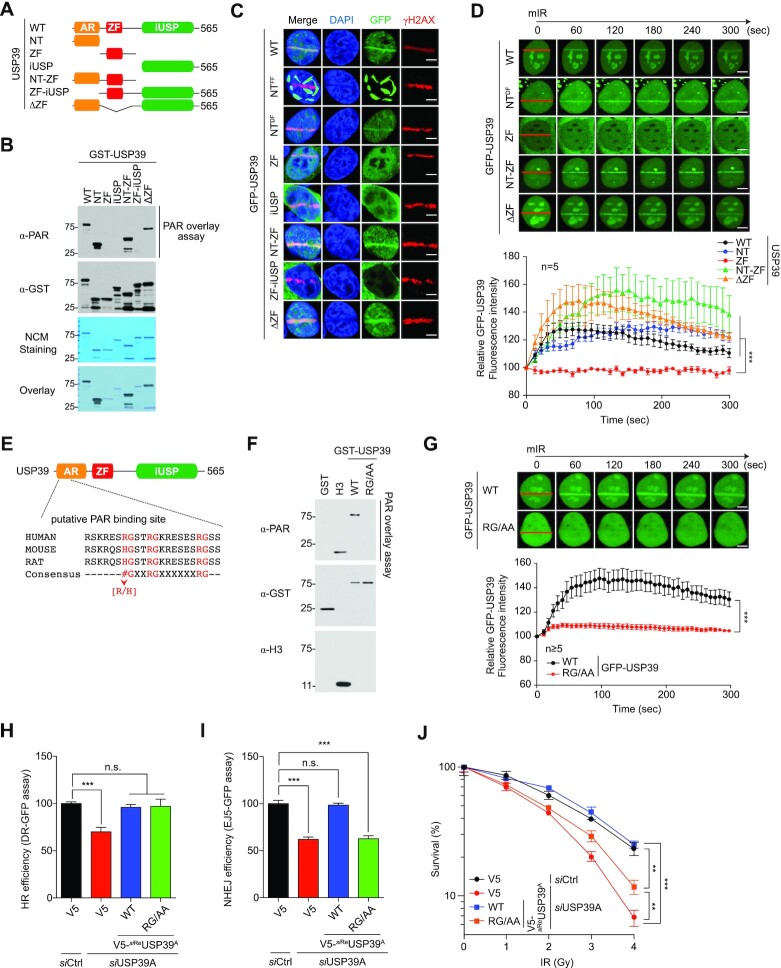
Figure 3.
The RG motif of USP39 is not only involved in interaction with PAR-chains but also essential for its recruitment to DNA lesions. (A) Schematic illustration of USP39 mutants. (B) Analysis of PAR-binding activity of USP39 WT or each deletion mutant. Indicated proteins were purified from insect cells and then used in PAR overlay assays. PAR-binding activity was monitored by immunoblot with the indicated antibody. (C and D) The N-terminal region of USP39 is critical for its recruitment to mIR-induced DSBs. Indicated mutants of GFP-tagged USP39 were transfected to U2OS cells, and stripe formation by USP39 WT or deletion mutants was analyzed from fixed (C) or living cells (D) as indicated. Data represent the mean ± s.e.m. from five cells. Statistical significance was determined using one-way ANOVA followed by the Tukey Kramer test (E) Identification of tripartite RG motifs as the putative PAR-binding sites in USP39. (F) Recombinant USP39 WT and RG/AA mutant were subjected to the PAR overlay assay as indicated. GST or H3 was used as negative or positive controls, respectively. (G) Tripartite RG motifs are critical for translocation of USP39 to mIR-induced DSBs. GFP-USP39 WT or RG/AA mutant were transfected into U2OS cells and mIR-induced stripe formation was monitored in living cells (upper panel). The efficacy of translocation was quantified as indicated (lower panel). Data represent the mean ± s.e.m. from five cells or more. Statistical significance was determined by the Student's t-test. (H and I) Comparative analysis of HR (H) and NHEJ (I) repair activities in USP39 knockdowns or cells rescued by reintroduction of siReUSP39 or RG/AA as indicated. Statistical significance was determined using one-way ANOVA followed by the Tukey–Kramer test (J) Clonogenic cell survival assay, which was performed using the indicated experimental conditions. Statistical significance was determined using one-way ANOVA followed by the Tukey Kramer test. Scale bars, 5 μm. Data represent the mean ± s.e.m. of three independent experiments. ***P ≤ 0.001, **P ≤ 0.01. n.s., not significant.

