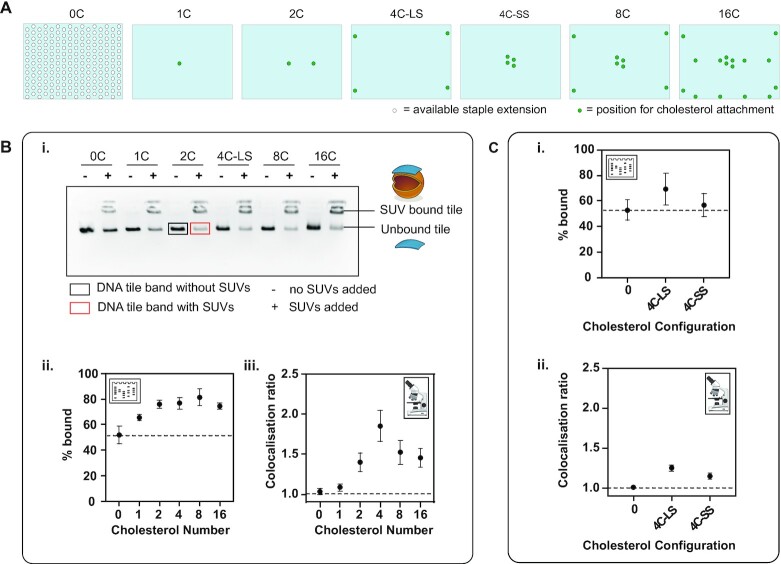
Figure 4.
Effect of number and configuration of cholesterols on membrane binding. (A) The different attachment points available on the DNA origami tile (light blue rectangle) for staple extensions (white circle) and the points selected for staple extension of handles H1 (green circle) for cholesterol attachment. (B) The effect of cholesterol number on membrane binding. (i) Gel image. (ii) Percentage bound from the gel analysis calculated from ratio of integrated band intensity in the presence of liposomes (red box) to the integrated band intensity in the absence of liposomes (black box). (iii) Colocalization ratios from microscopy. (C) The effect of cholesterol configuration on membrane binding. (i) Percentage bound obtained from gel analysis. (ii) Colocalization ratios from microscopy.

