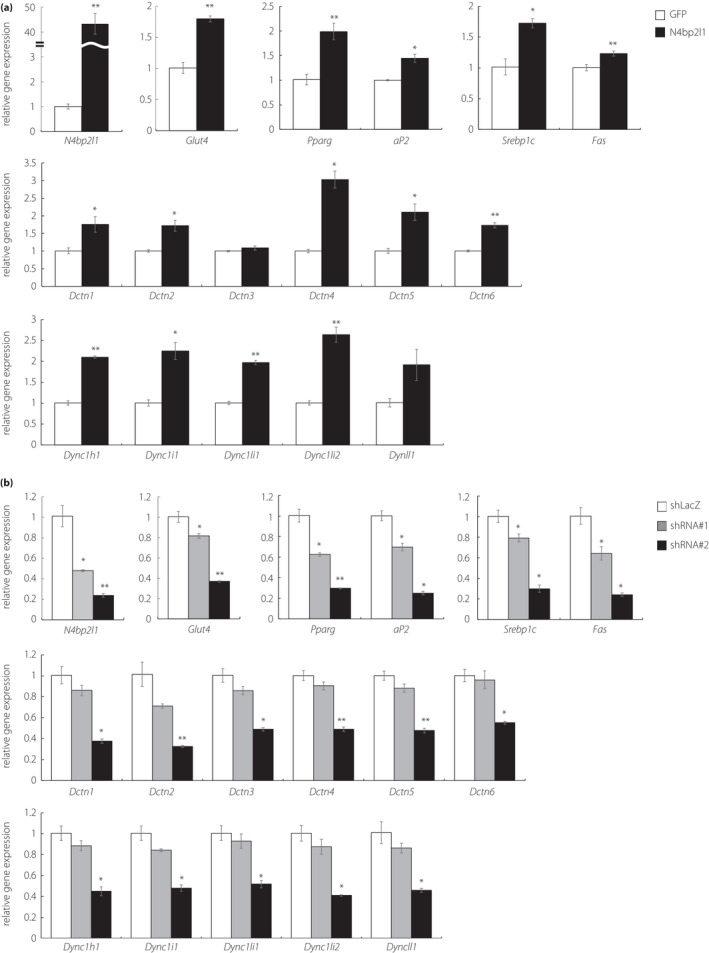
Figure 5.

The effect of N4BP2L1 on gene expression levels in 3T3‐L1 adipocytes. (a and b) 3T3‐L1 adipocytes were infected with either GFP or N4bp2l1 adenovirus or either shLacZ or N4bp2l1 shRNA adenovirus. After 48 h, total RNA was extracted and subjected to qPCR. n = 3 per group, *P < 0.05, **P < 0.01 vs GFP or shLacZ.
