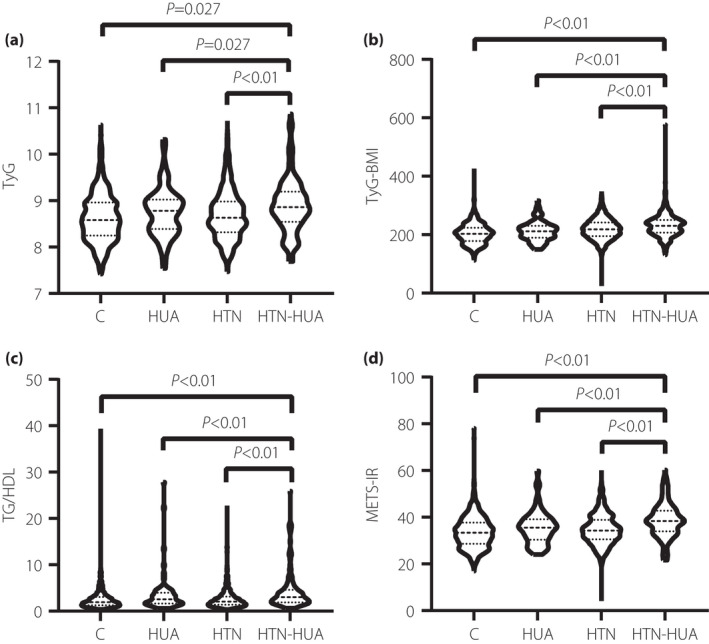
Figure 1.

Glucose and triglycerides index (TyG index), TyG index with body mass index (TyG‐BMI), the ratio of triglycerides divided by high‐density lipoprotein cholesterol (TG/HDL‐C) and metabolic score for insulin resistance (METS‐IR) values in different groups. (a) The mean values of TyG in in the control group (C group), hyperuricemia (HUA) group, hypertension (HTN) group and hypertensive patients with hyperuricemia (HTN‐HUA) group were 8.66, 8.82, 8.82 and 8.96, respectively. (b) The mean values of TyG‐BMI in the C group, HUA group, HTN group and HTN‐HUA group were 203.28, 212.11, 219.16 and 230.73, respectively. (c) The mean values of TG/HDL‐C in the C group, HUA group, HTN group and HTN‐HUA group were 2.66, 3.60, 2.97 and 4.07, respectively. (d) The mean values of METS‐IR in the C group, HUA group, HTN group and HTN‐HUA group were 33.85, 35.97, 36.83 and 39.60, respectively. All the values in the HTN‐HUA group were significantly higher than in the other three groups (P < 0.05).
