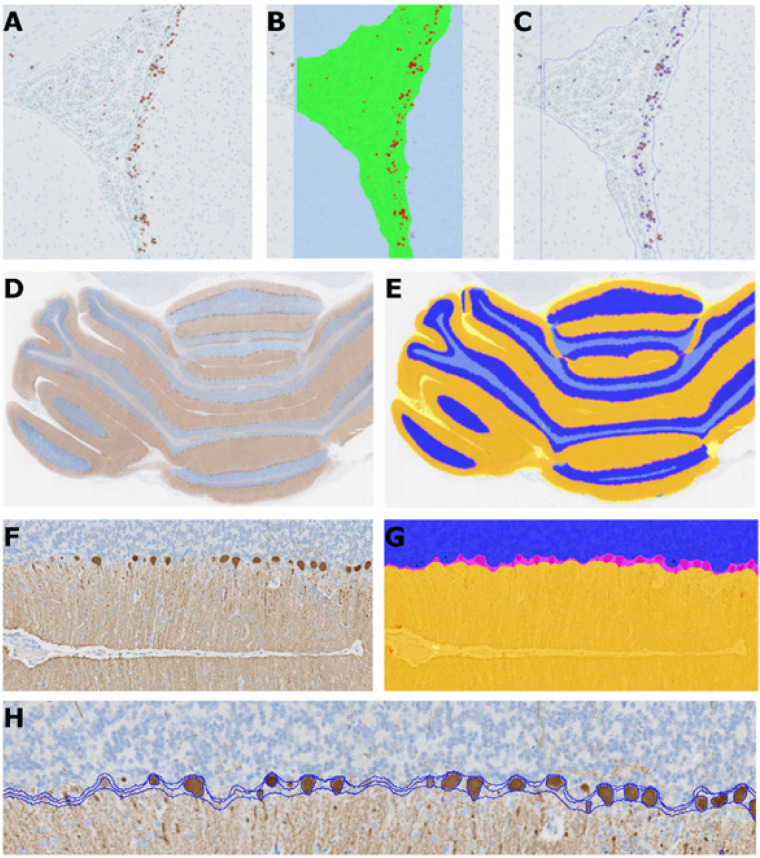
Fig. 4.
Automated image-analysis-based quantification of cell proliferation and distribution of Purkinje cells. Original Ki67 image (A). Image overlay showing the region of interest in green and the detected Ki67 positive areas in red (B). Outline of the detected areas (C). Original calbindin-D28k image (D). Image overlay showing the molecular layer (orange), granular cell layer (blue) and the interface area (light grey) with Purkinje cell layer (magenta) and white space (yellow) (E). Part of the original image at higher magnification, showing the molecular layer with the Purkinje cells (F). Image overlay at higher magnification (G). Outline showing the different cell layers and the interface area with the detected Purkinje cells (H).

