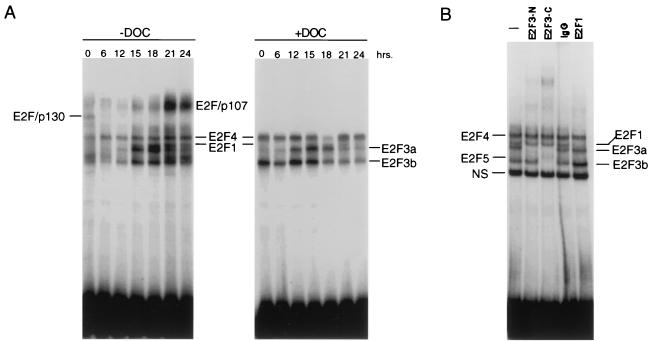
FIG. 4.
Control of E2F3 DNA binding activity following stimulation of cell growth. (A) E2F DNA binding activity following stimulation of cell growth. REF52 cells were brought to quiescence and then stimulated by the addition of medium containing 10% serum. Cells were harvested at the indicated times following the stimulation of growth, nuclear extracts were prepared, and E2F DNA binding activity was measured using electrophoretic mobility shift assays as previously described. A sample of each nuclear extract was also treated with DOC and then analyzed for E2F DNA binding activity. (B) Identification of distinct E2F3 activities. A nuclear extract sample from the 18-h time point presented in the left panel (G1/S sample) was incubated without antibody (lane 1), an E2F3 antibody specific for the N terminus of E2F3a (lane 2), and E2F3 C-terminus-specific antibody that recognizes both E2F3a and E2F3b (lane 3), control IgG (lane 4), or an E2F1-specific antibody prior to being subjected to gel shift analysis. The E2F4- and E2F5-specific bands indicated on the DNA gel shift have been identified using specific antibodies against the respective proteins (data not shown).

