FIGURE 4.

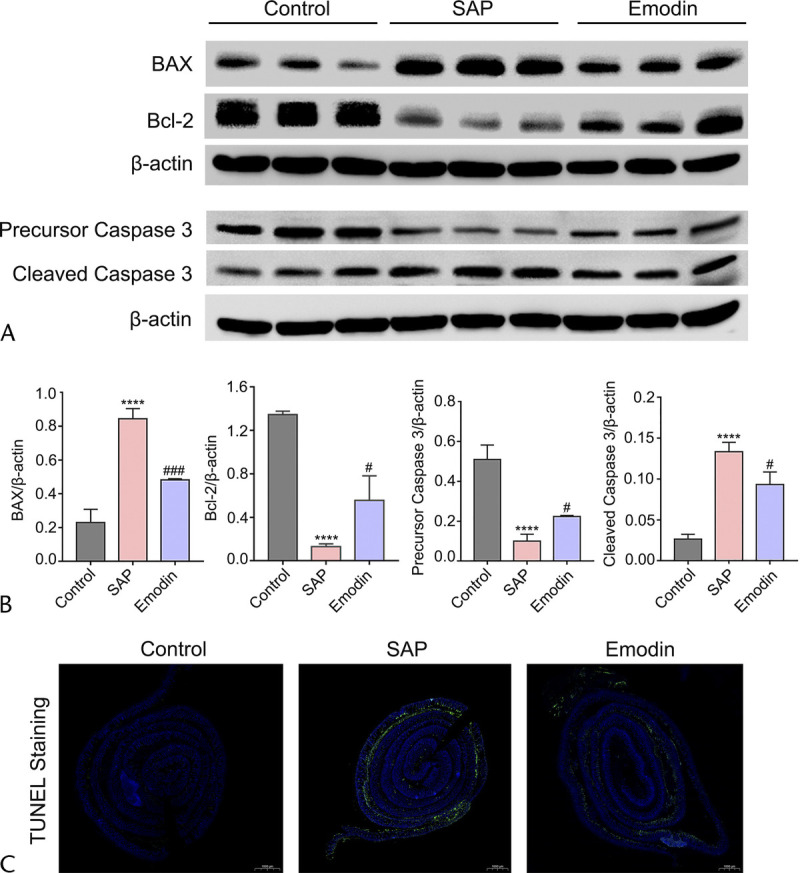
Changes in the protein levels of the BAX/Bcl-2/caspase 3 signaling pathway in the different groups. A, Western blot imaging of the BAX, Bcl-2, and caspase 3 proteins. B, The relative expression of the BAX, Bcl-2, and caspase 3 protein. C, The expression of claudin 4, ZO-1, and occludin in intestines by immunohistochemistry staining. ****P < 0.05 versus the control group; ###P < 0.001 versus the SAP group, #P < 0.05 versus the SAP group.
