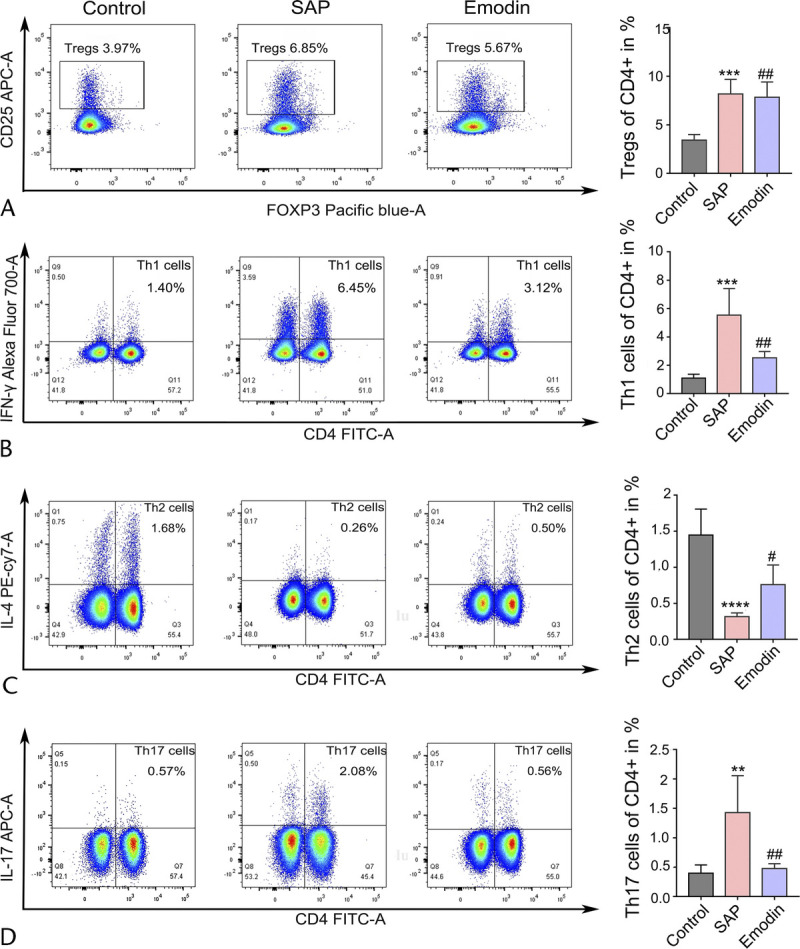
FIGURE 5.

Effects of emodin on the subsets of CD4+ T cells in the spleen of the SAP mice. The ratio of the TH1 cells (A), TH2 cells (B), TH17 cells (C), and Treg cells (D) in the CD4+ T cells of the spleen, analyzed by flow cytometry in mice. **P < 0.01 versus the control group; ***P < 0.001 versus the control group; ***P < 0.0001 versus the control group; #P < 0.05 versus the SAP group; ##P < 0.01 versus the SAP group; NS, not significant.
