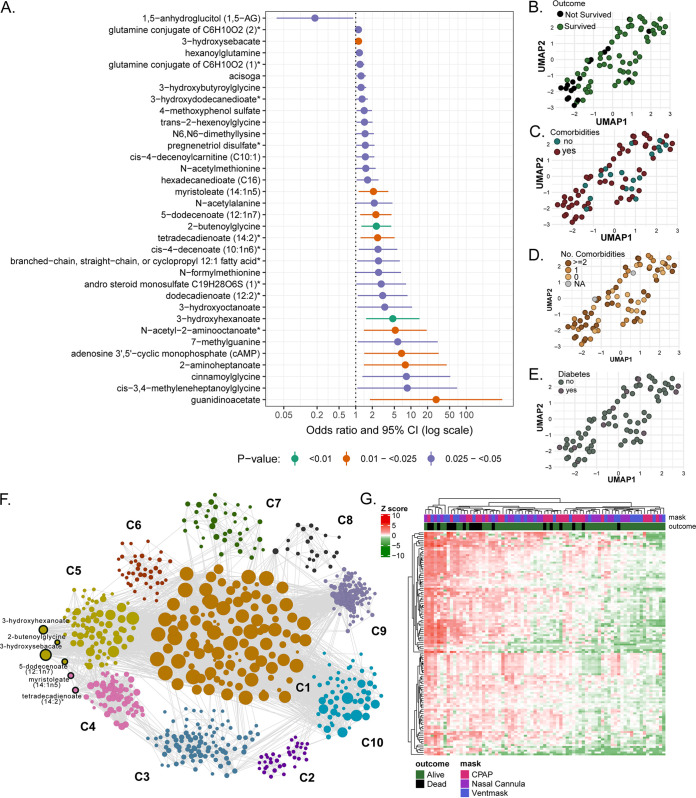
FIG 1.
Metabolites that are significantly associated with COVID-19-related in-hospital mortality. (A) All biomarkers that were significant at the 0.05 level, after adjusting for age, gender, and BMI, were included in the plot and ordered by the value of the odds ratio. Color coding for lower P values is presented in the legend. (B to E) UMAP visualization of patients’ data after selecting the 10 death biomarkers. Patients were labeled for the outcome (B), presence of comorbidities (C), number of comorbidities (D), and presence of diabetes (E). (F) Global weighted network after community detection. Biomarkers with COVID-19-related mortality belong to communities 4 and 5 (labeled). The size of the bubble represents the connectivity of each metabolite. (G) Heat map of potential biomarkers and their first neighbors in patients using metabolite abundance levels from network analysis in patients labeled for mask types and outcome (survivors/nonsurvivors). The data were log-transformed, and hierarchical clustering was applied to both metabolites and patients.

