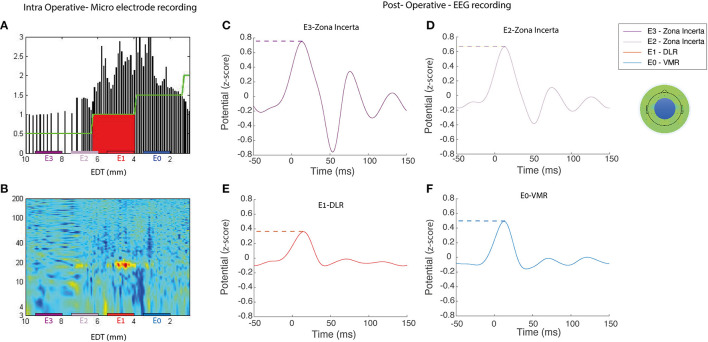
Figure 1.
Representative example of intra- and postoperative recordings. An example of intraoperative and postoperative recordings for a single subject (no S8) (left) Microelectrode recording during the DBS implantation in the right STN, the normalized root mean squared [NRMS, (A)], power spectral density [PSD, (B)] in a contact location of a patient STN. EDT, estimated distance to target (defined as STN center, according to preoperative imaging). (C–F) ERP activity of the average EEG electrodes in the medial frontal central area (represented by the blue circle on the topoplot) reveals postoperative stimulations by each of the four DBS contacts; dashed color lines represent the max-peak feature and one of the extracted engineered features. It can also be observed that the signal arises slightly before stimulus onset. Rather than a detection error, this results from the effect of the filter on the interpolated signal, which replaced the stimulus artifact. DLR, dorso-lateral region; VMR, ventro-medial region.

