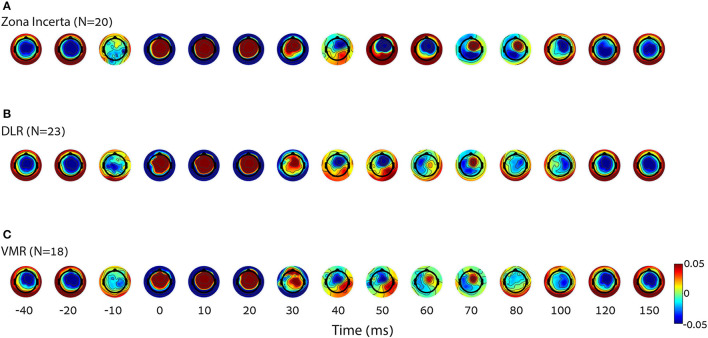
Figure 3.
Differences in cortical activity per condition. The average of group topoplot 40 ms before and 150 ms after stimulation reveals a different cortical activity in terms of spatial and time specifics, mostly around 50–100 ms, elicited by DBS in three right STN locations [top down: (A) zona incerta (N = 20), (B) DLR (N = 23), (C) VMR (N = 18)]. The X axis is nonlinear to emphasize the relevant parts. It can also be observed that the signal arises slightly before stimulus onset. Rather than a detection error, this results from the effect of the filter on the interpolated signal, which replaced the stimulus artifact. DLR, dorso-lateral region; VMR, ventro-medial region.

