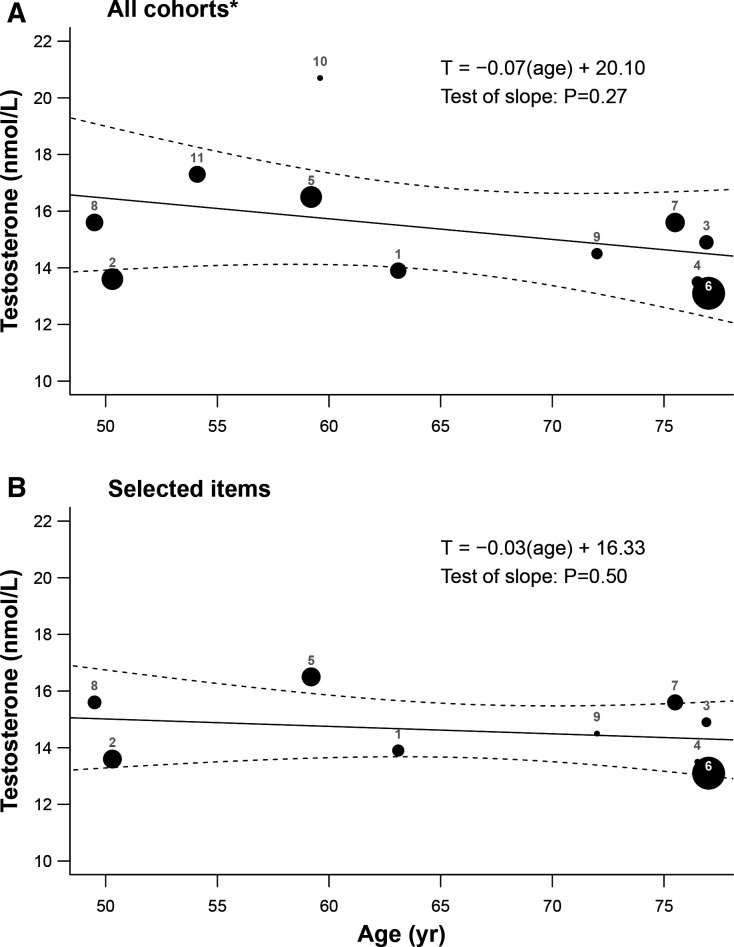
Figure 2.
Metaregression of mean testosterone on mean age for (A) all 11 cohort studies and (B) 9 studies with articles that were selected by systematic literature searches and screening. The size of plotted points refers are proportional to the inverse of the corresponding SEs (indicative of relative weightings), with lines demonstrating the fitted model and 95% CIs. Plotted estimates are numbered as from the following articles (cohort studies): 1=Srinath et al48 (ARIC); 2=Chan et al37 (BHS); 3=Hsu et al9 (CHAMP); 4=Shores et al50 (CHS); 5=Lee et al43 (EMAS); 6=Chan et al41 (HIMS); 7=Ohlsson et al44 (MrOS Sweden); 8=Kische et al46 (SHIP); 9=Sueoka et al53 (MrOS USA); 10=Pencina et al57 (FHS); 11=Li et al56 (MAILES). *=includes articles from two additional studies (FHS, MAILES) that were not identified from systematic searches but by colleagues.

