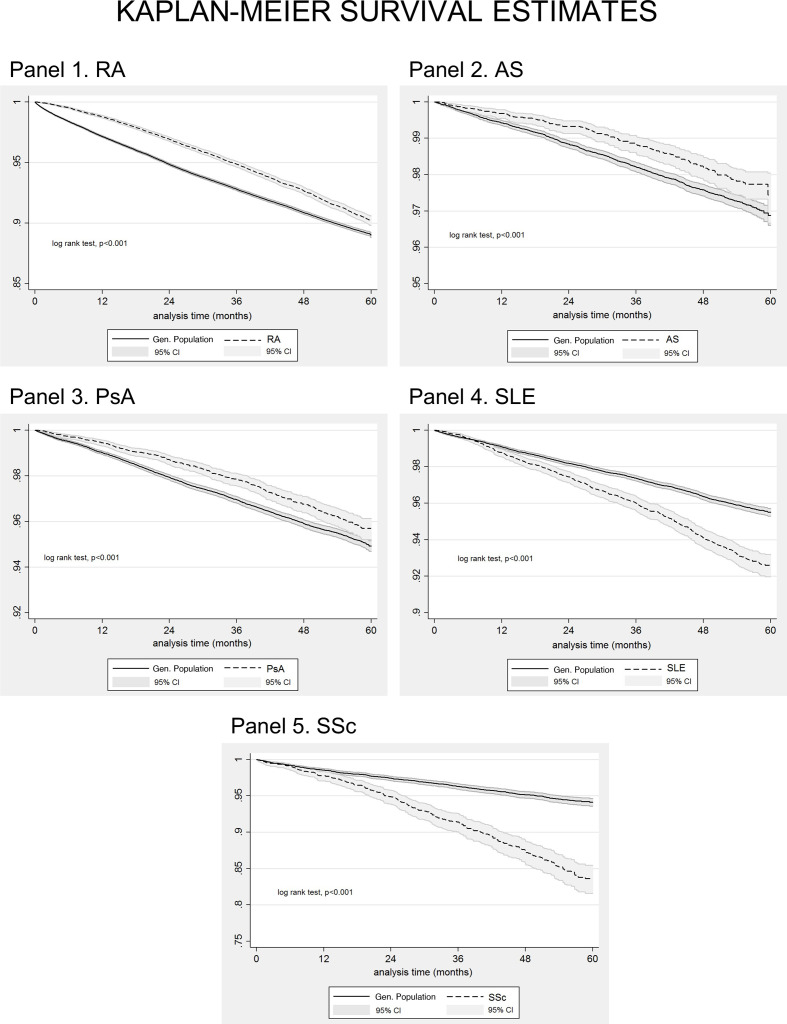
Figure 1.
Kaplan-Meier survival curves for patients with rheumatoid arthritis (RA, N=42 735, panel 1), ankylosing spondylitis (AS, N=9707, panel 2), psoriatic arthritis (PSA, N=13 779, panel 3), systemic lupus erythematosus (SLE, N=10 440, panel 4), systemic sclerosis (SSC, N=2277, panel 5), and for age-matched and gender-matched individuals from the general population (1:5 exposed: unexposed ratio) included in our cohort between 1 January 2015 and 31 December 2019. Analysis time in months.

