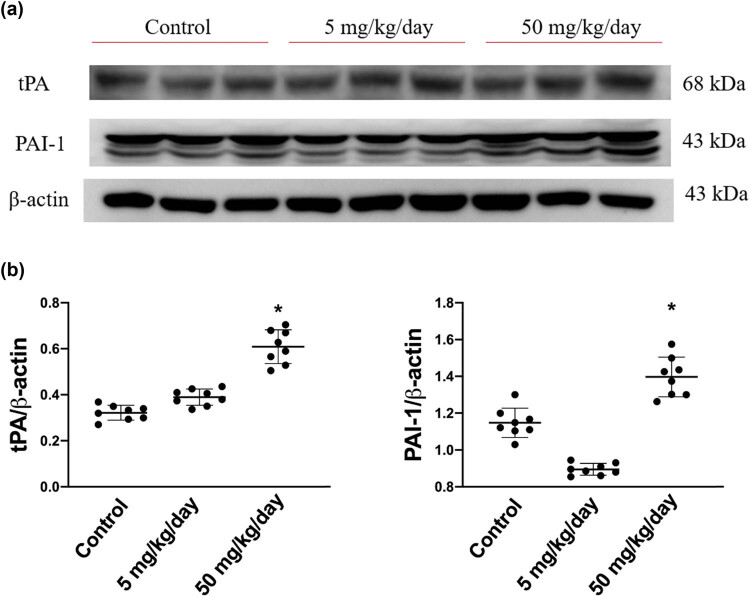
Figure 6.
tPA and its inhibitor, PAI protein expression levels in arecoline-treated rats. (a) PAI and tPA protein expression levels were examined by Western blot analysis of left ventricular samples from control, low-dosage, and high-dosage arecoline-treated rats. (b) Data were quantified densitometrically and expressed as mean ± SEM. Protein expression was normalized to β-actin expression. *Significant difference (P < 0.05).

